An innovative take on Biological data
Introduction
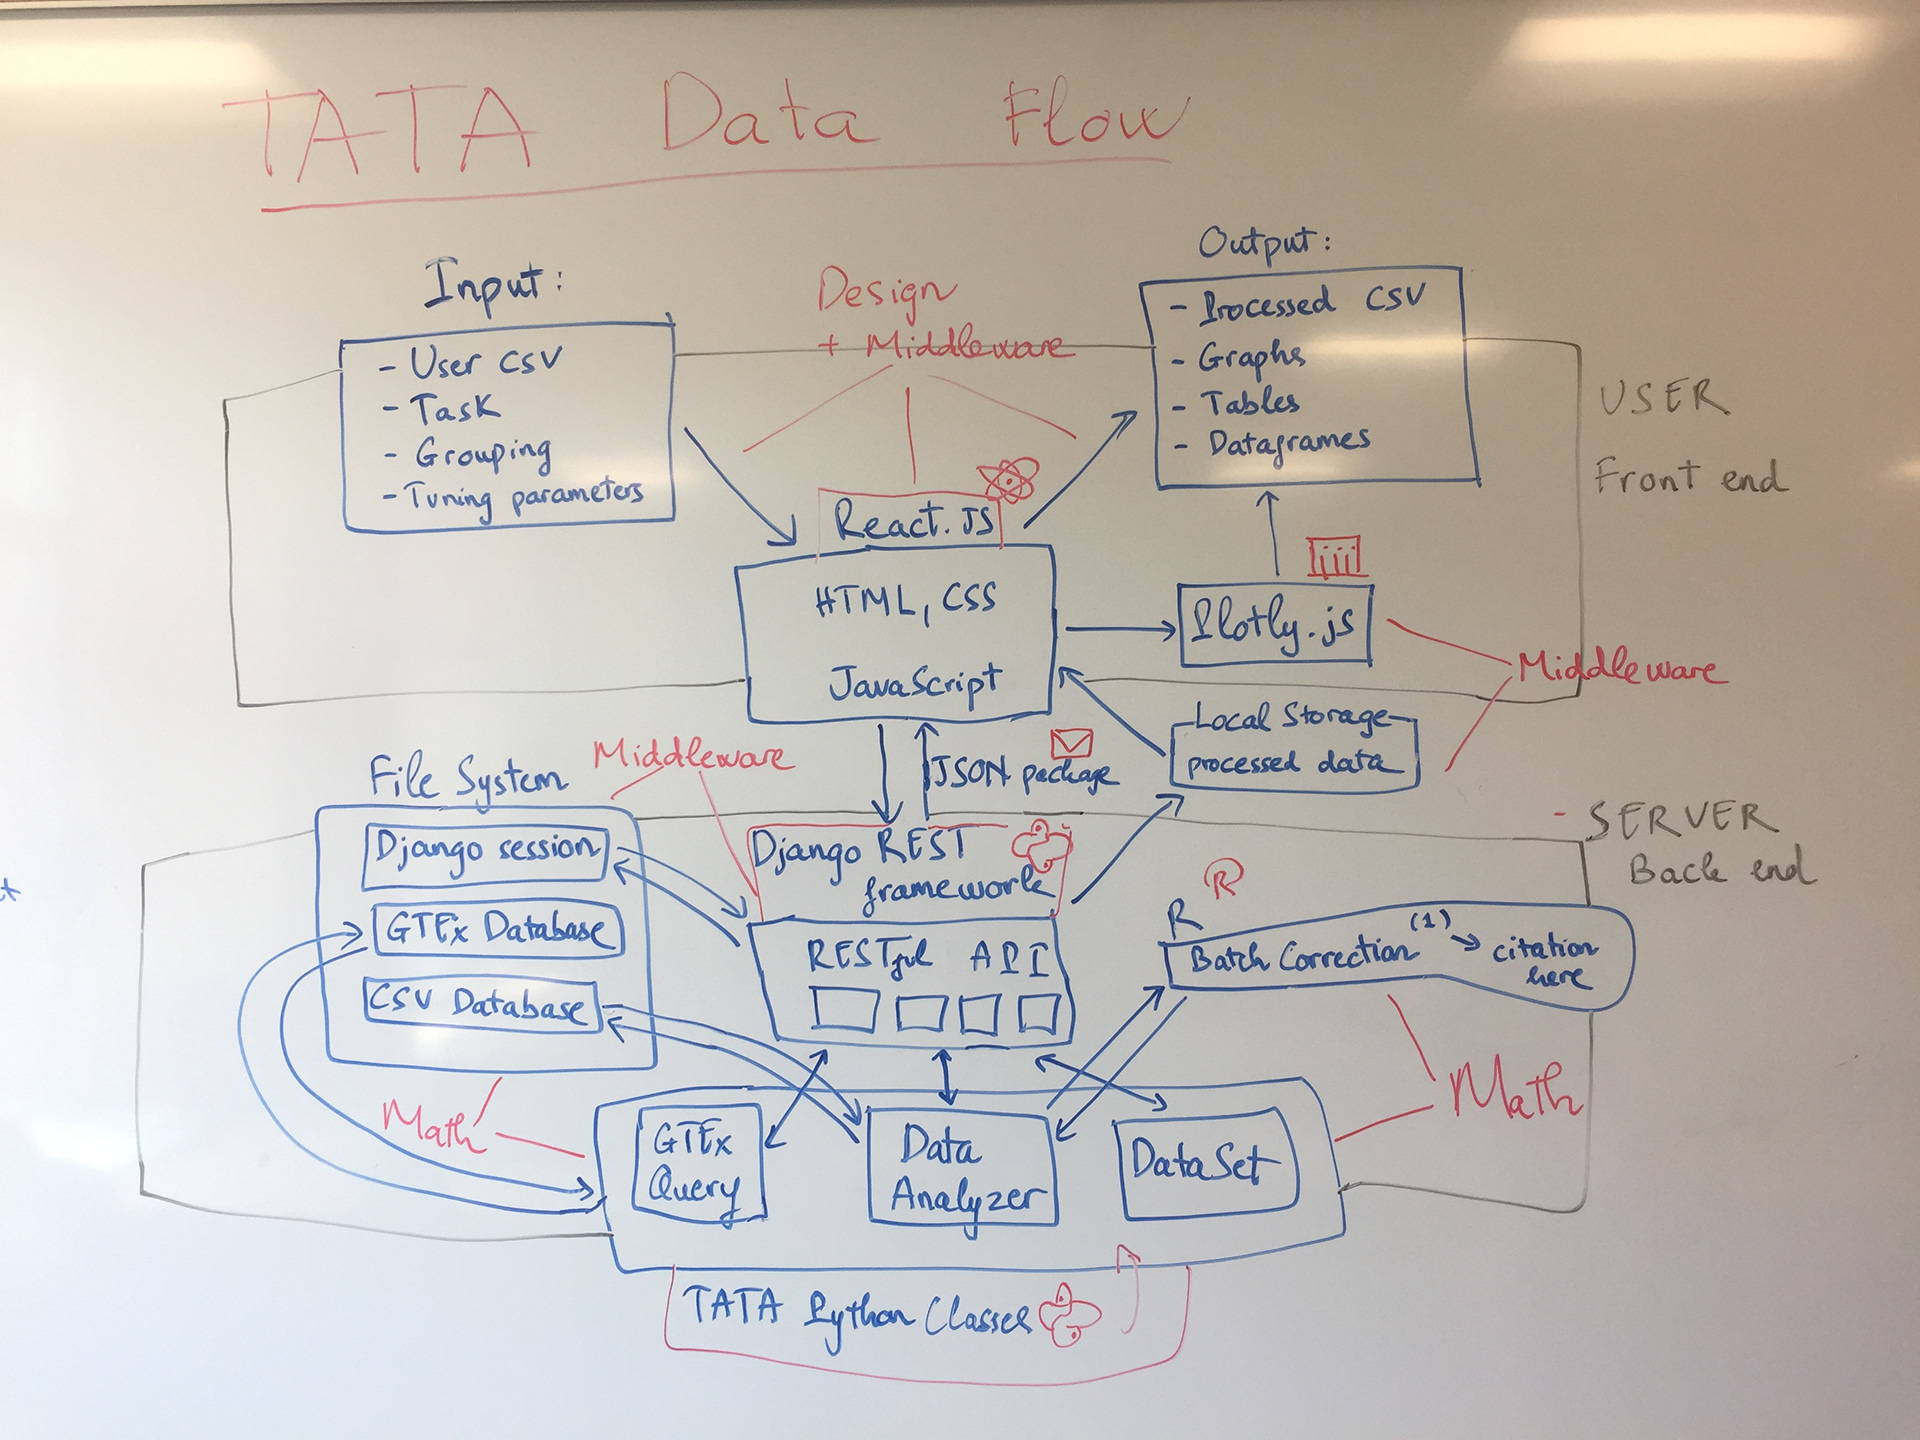
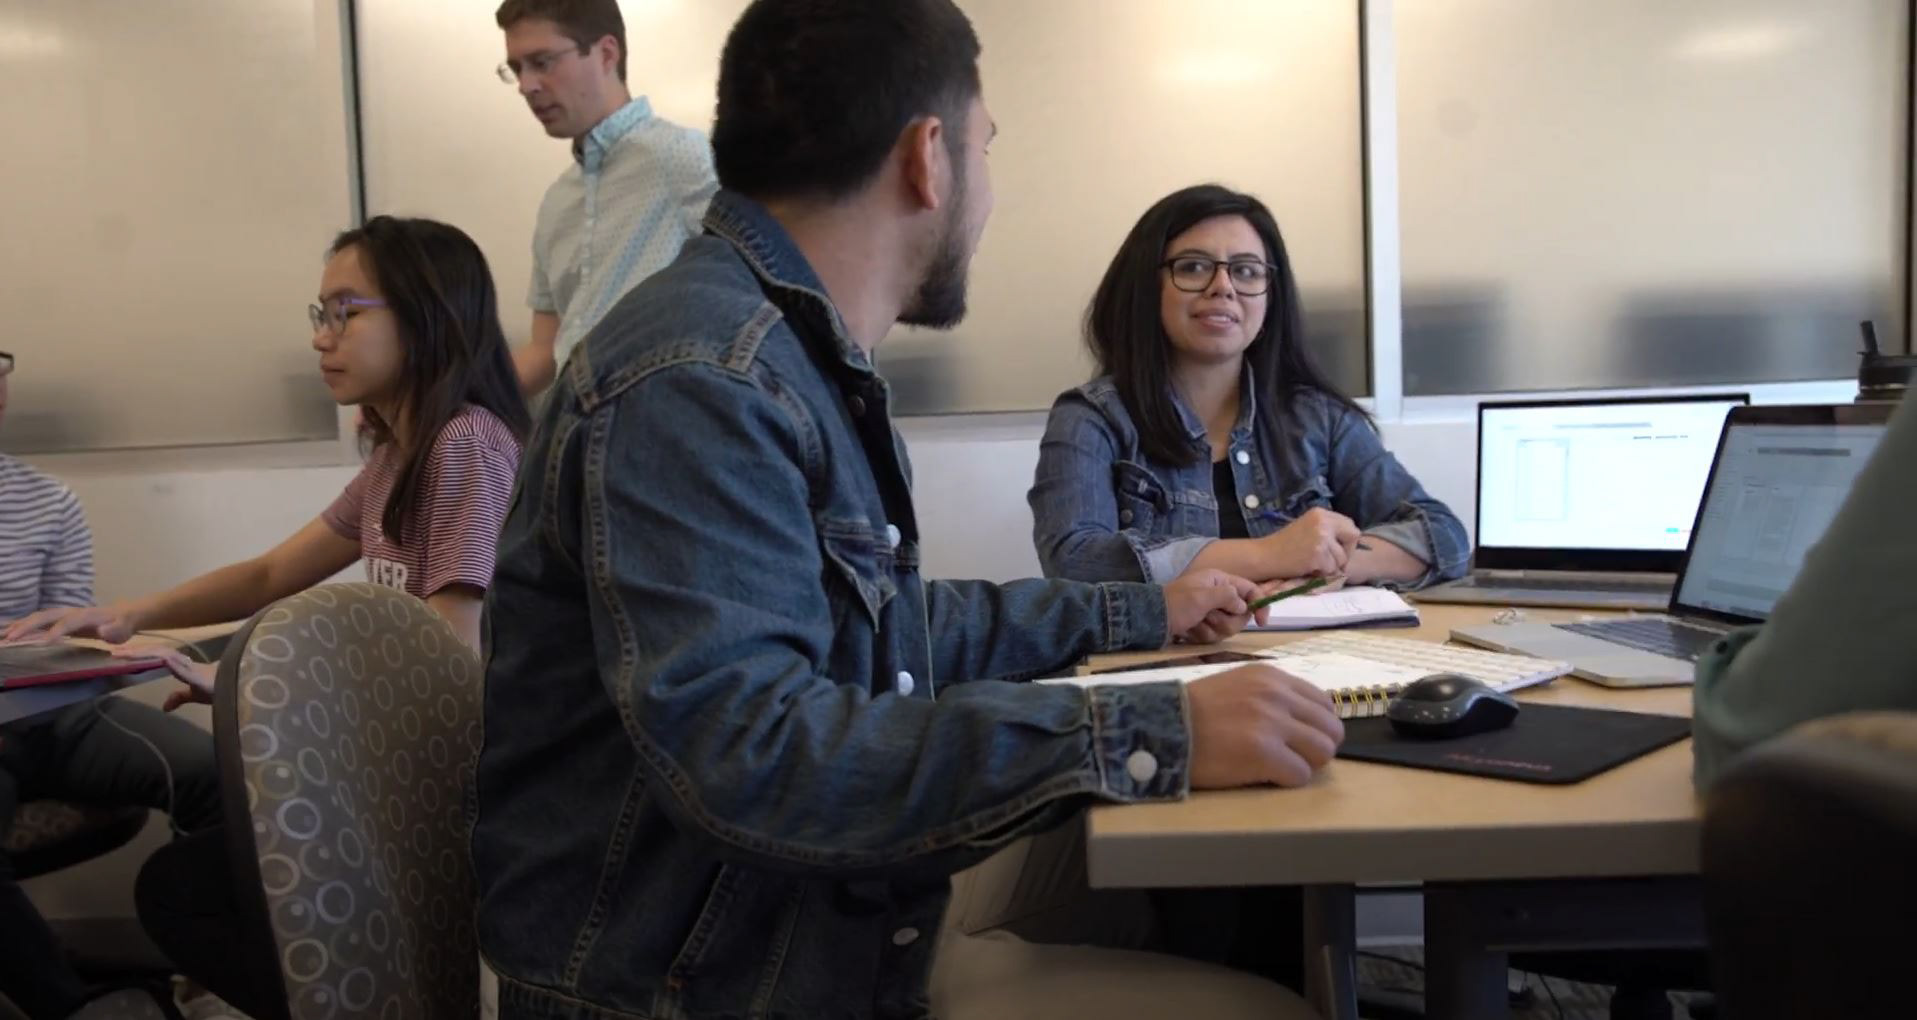
As a UI design intern, I worked on a project titled "Translating Significant Biological Data through a Novel, Intuitive Graphical User Interface" at George Mason University. The tool assists biologists in analyzing genetic data with algorithms, defining significant genes through graph visualization. A multidisciplinary team consisting of front-end designers, middleware developers, and back-end developers collaborated for ten weeks to design the tool.
Challenge
Collaborate with a team to create a user-friendly intuitive interface. Additionally, design and develop branding visuals to appeal to the market audience.
Solution
As part of the three-person front-end design team, we formulated user scenarios to define user goals to help build the information architecture. We used Adobe XD to design wireframes into prototypes and collaborated in Illustrator to create the brand. Each team member was tasked to code a responsive page for tablets, laptops, and desktops. Next, we delivered our code to middleware and back-end developers to successfully integrate the design with the data flow to launch a functional web tool.
The following images are TATA webtool in Desktop form. View the high fidelity prototype, here.
LANDING PAGE
CONTRIBUTOR PAGE
INITIAL VALIDATION PAGE
CHOOSE TASK PAGE
GROUP SAMPLES PAGE
GTEX POP UP
PROGRESS PAGE
BATCH CORRECTION PAGE
ALGORITHMS AND TUNNING PAGE
LOADING PAGE
JOB CODE PAGE
ERROR PAGE
Connecting the data
Research
Before designing the tool, we went through a briefing with the George Mason University biology and math mentors to get a better understanding of bioinformatics. Biologists work with large gene samples that need to be compared to other large gene samples to find a connection. Here is where the team used different algorithms – in this case, Differential Expression and Co-Differential Expression were utilized. The outputs were visual plots and graphs of the significant genes, aiding users in multiple areas of scientific research. To view the poster in PDF, click here.
Strategizing an intuitive flow
User Scenario
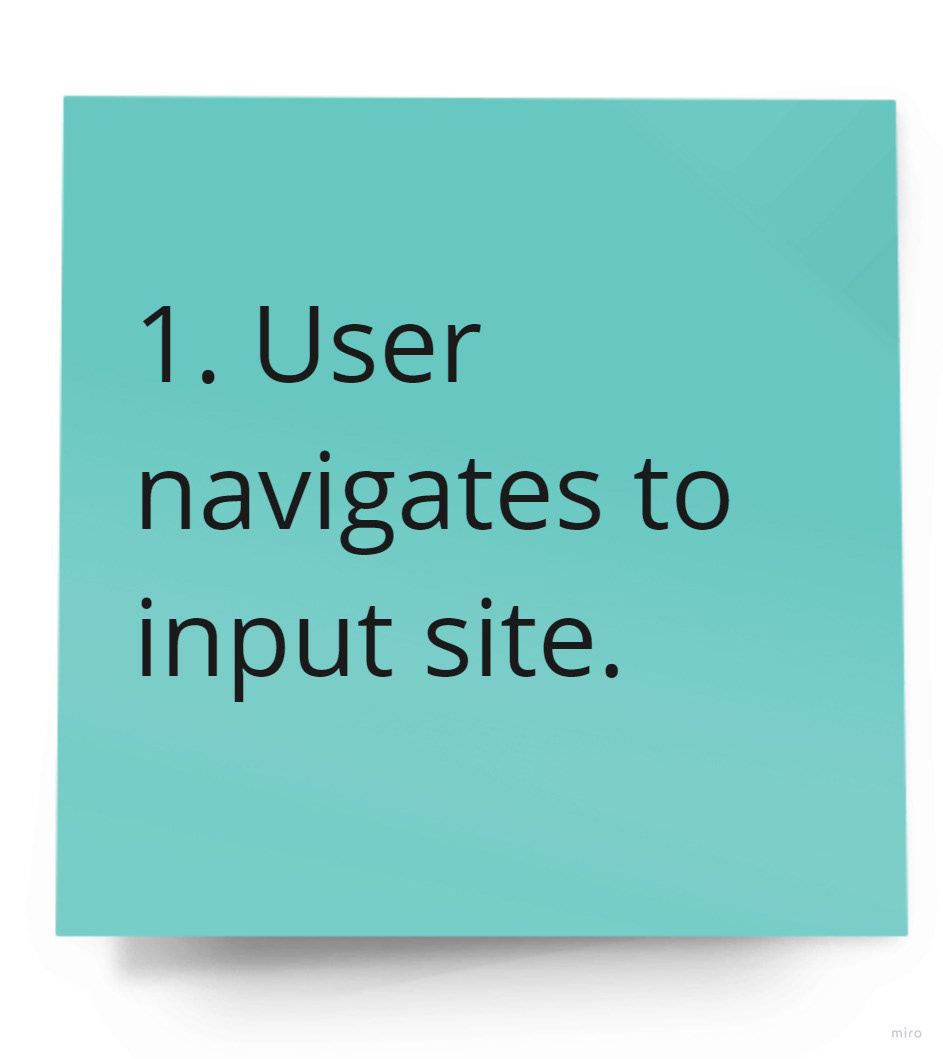
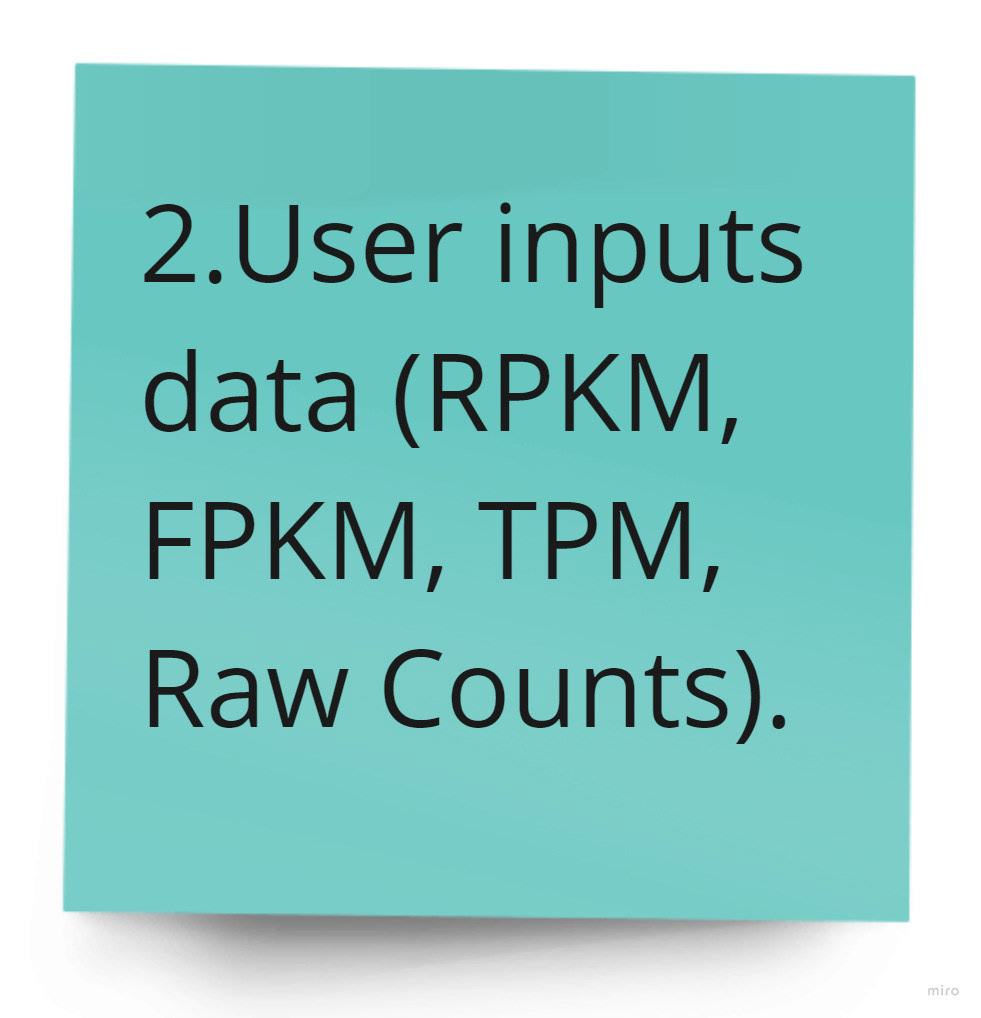
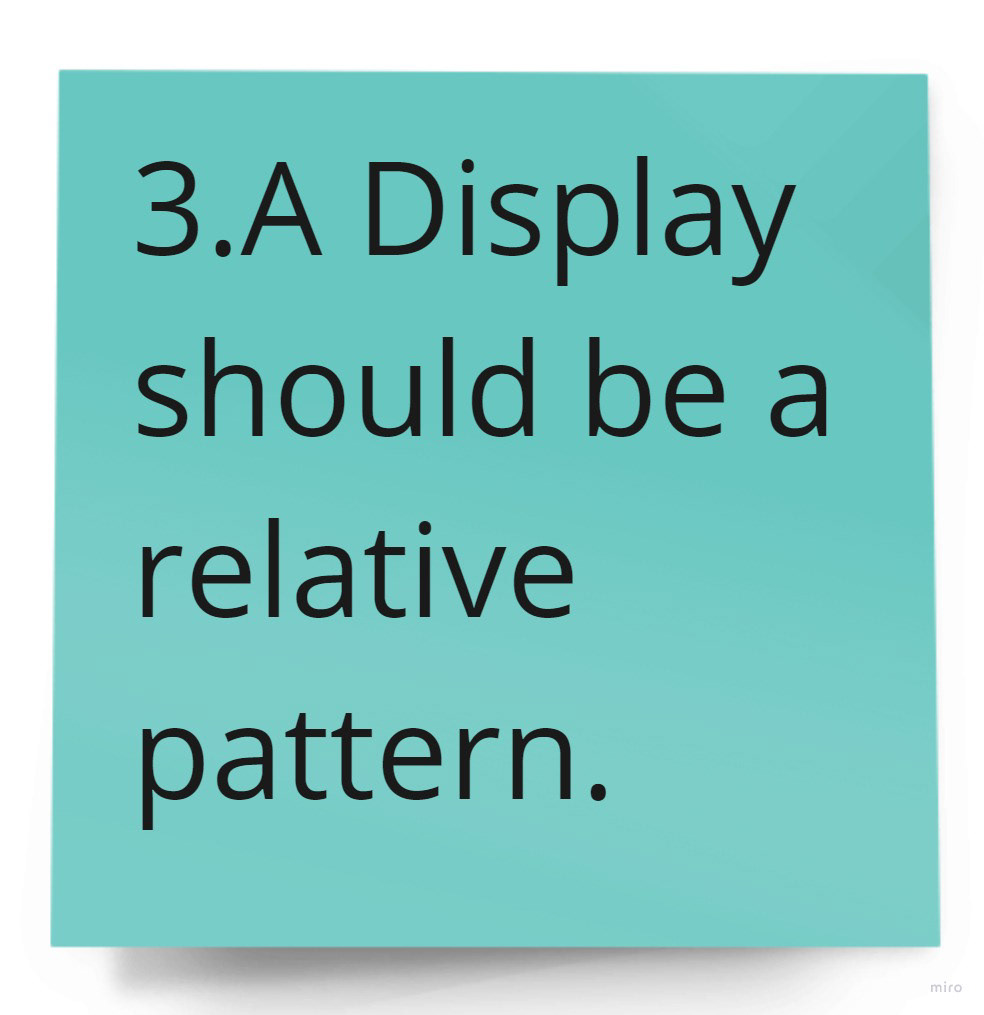
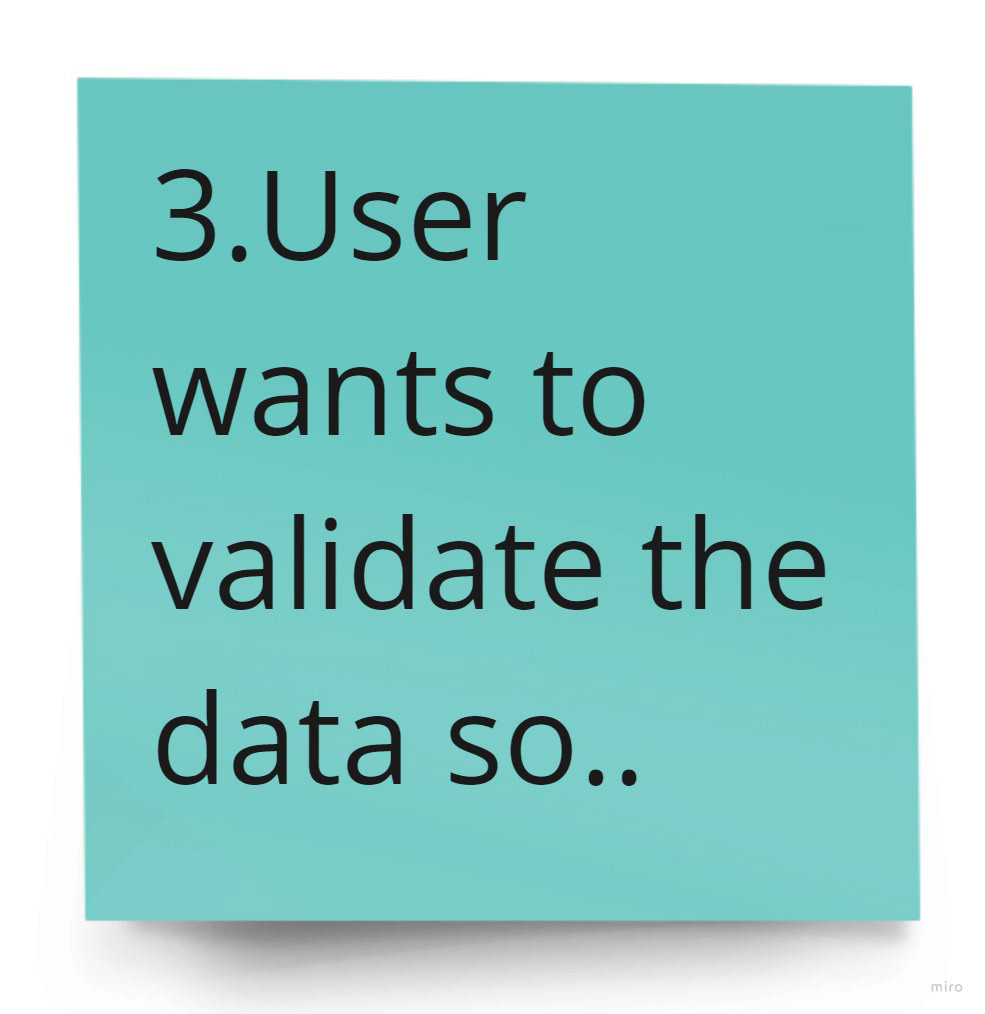
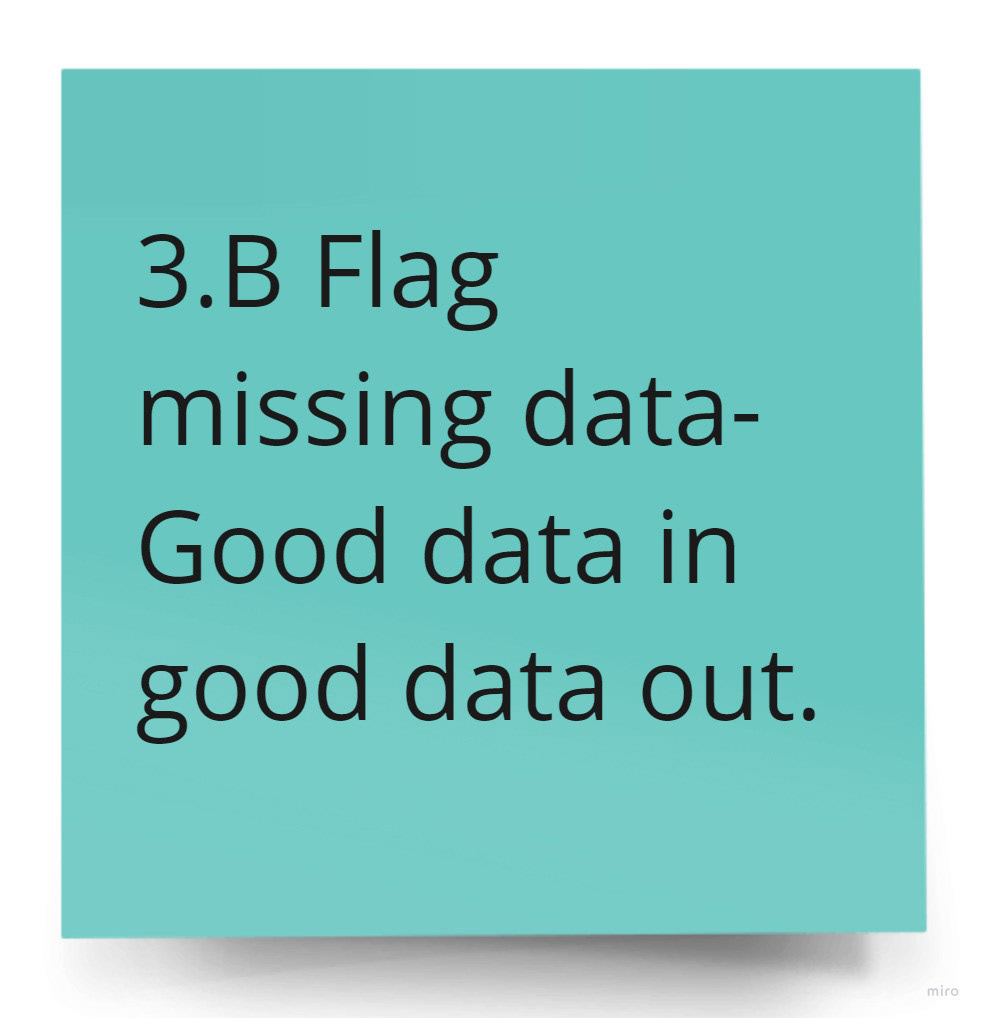
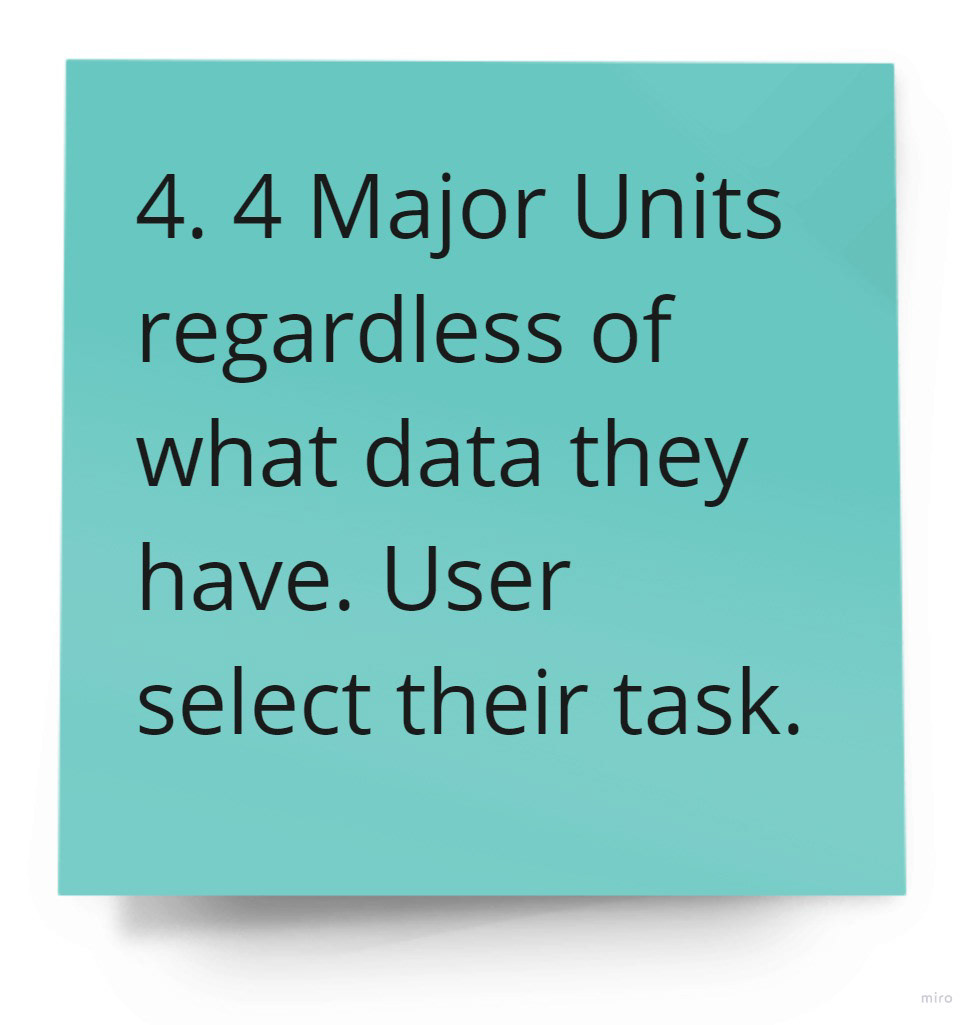
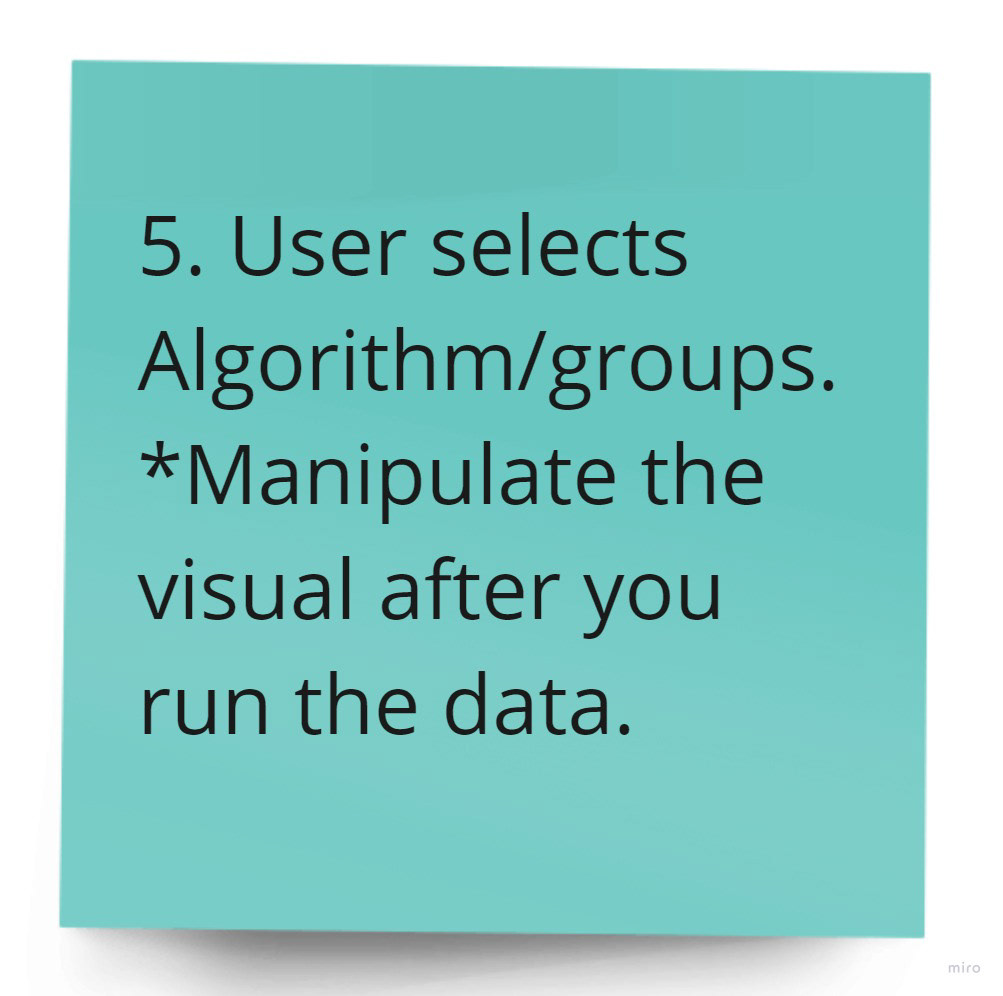
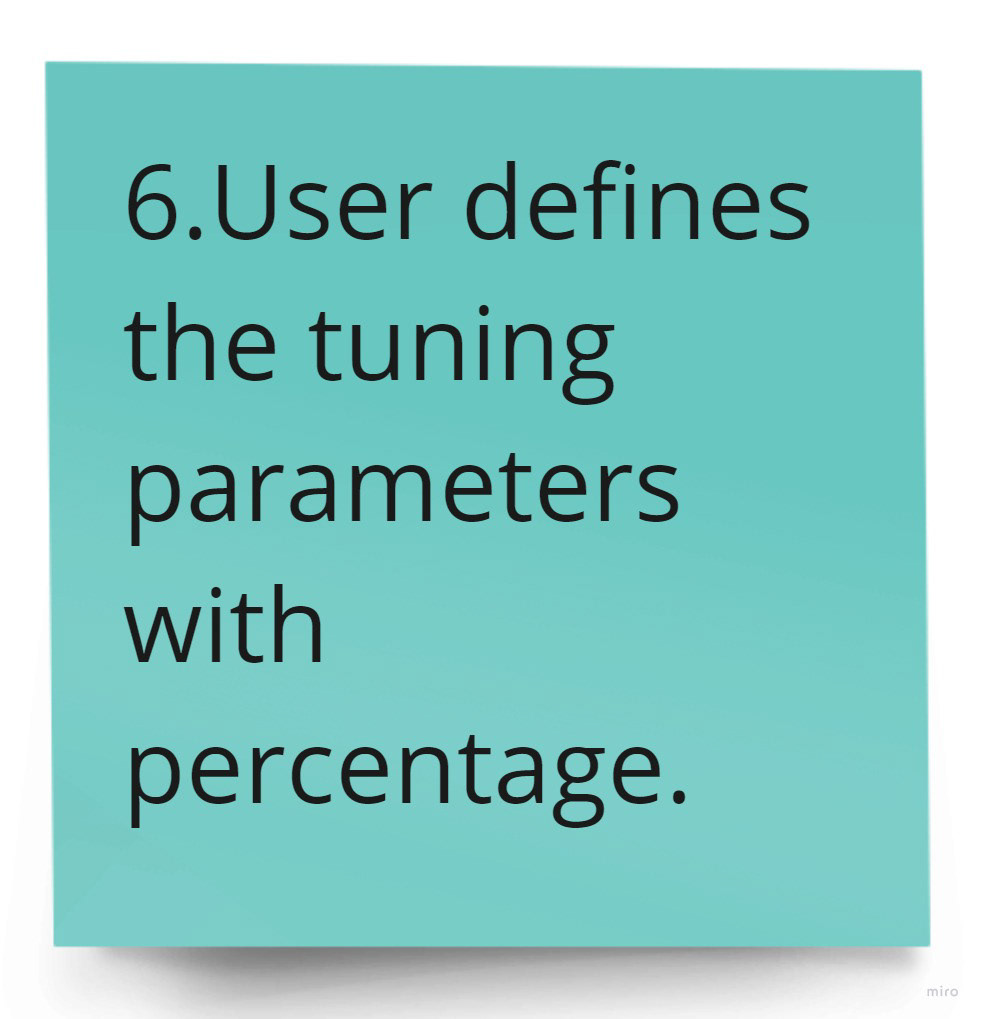
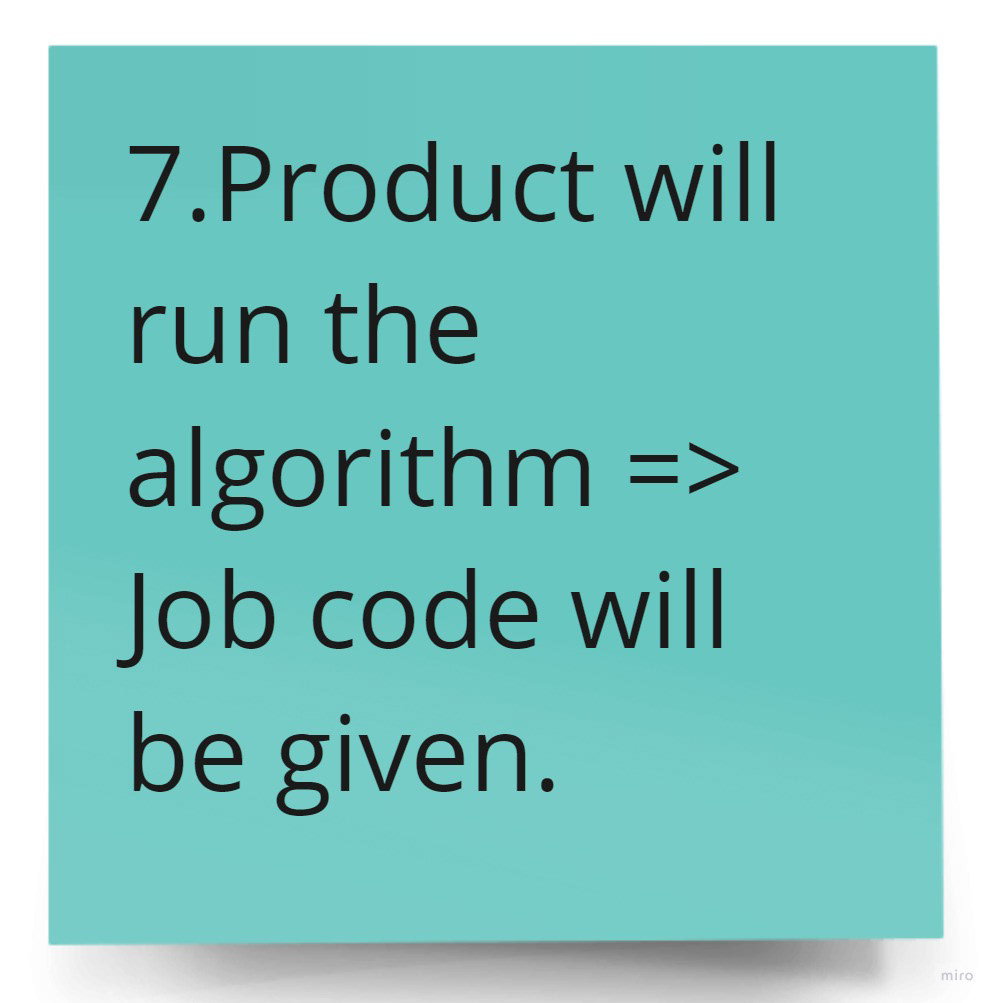
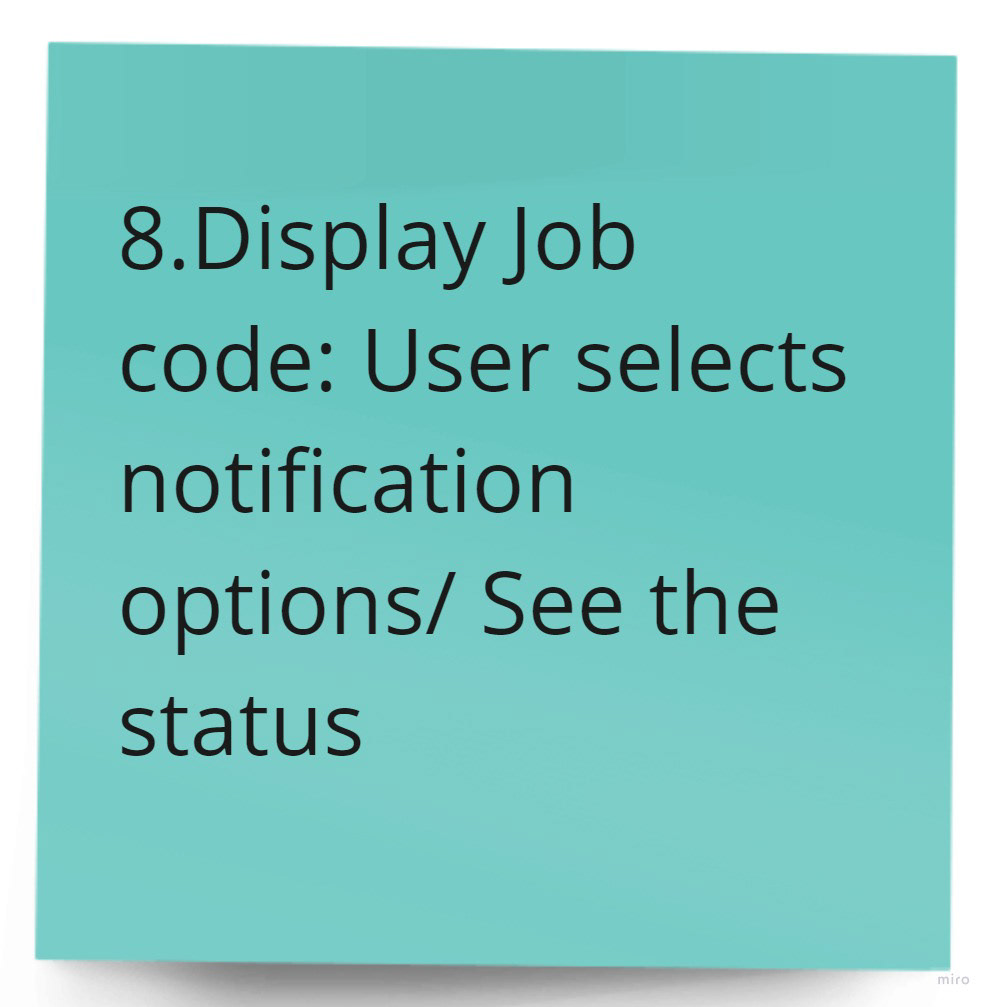
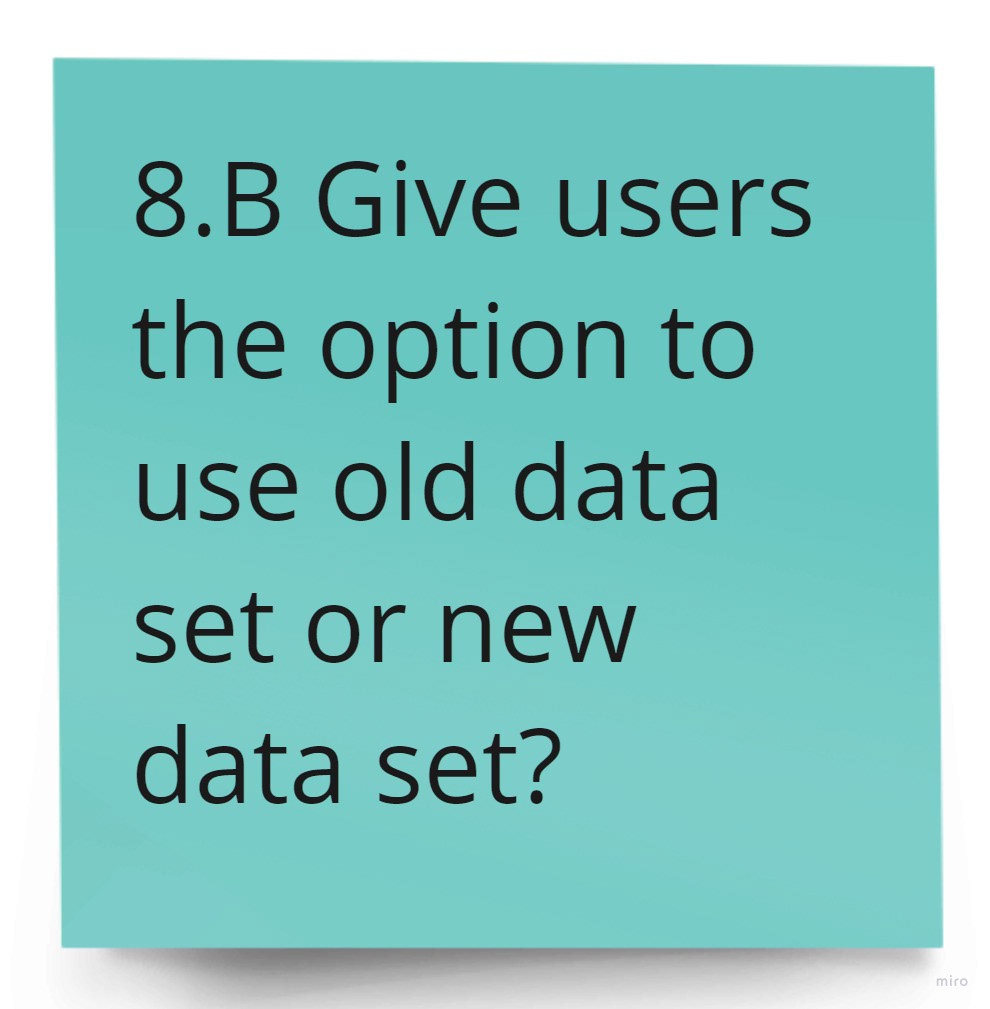
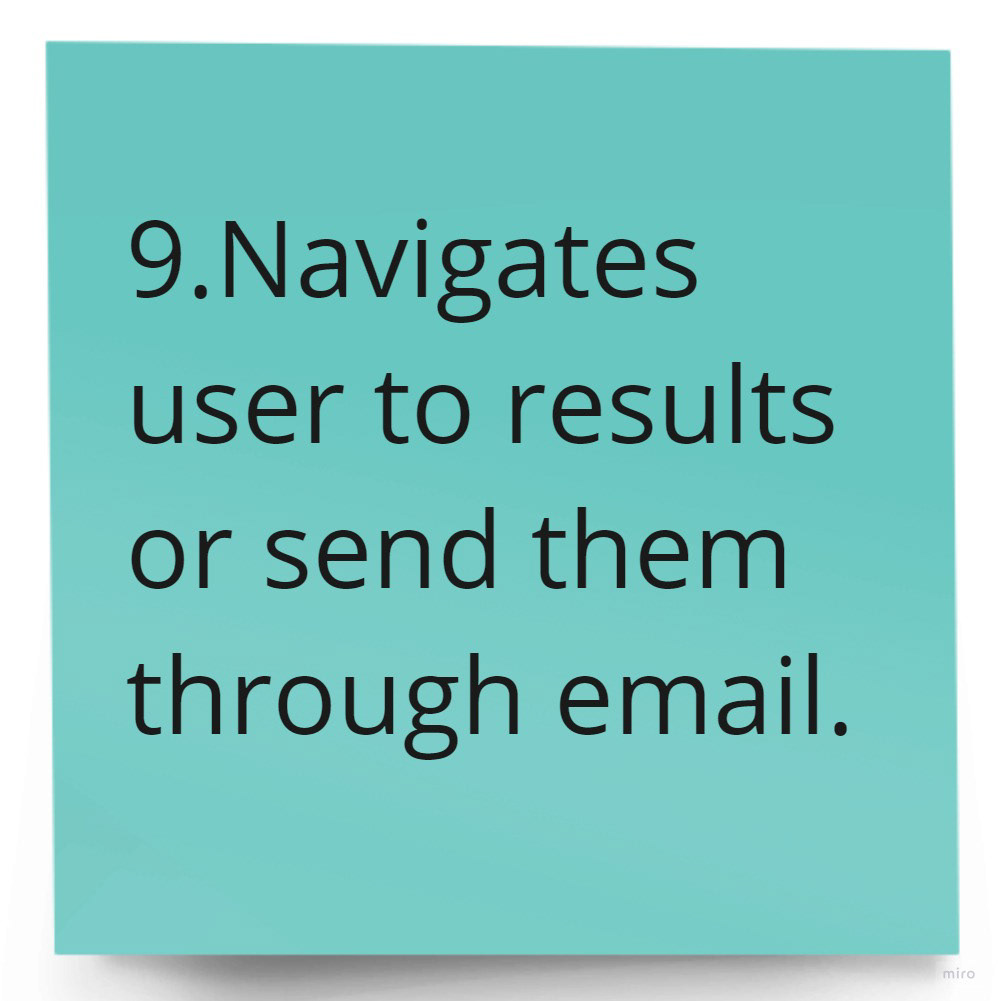
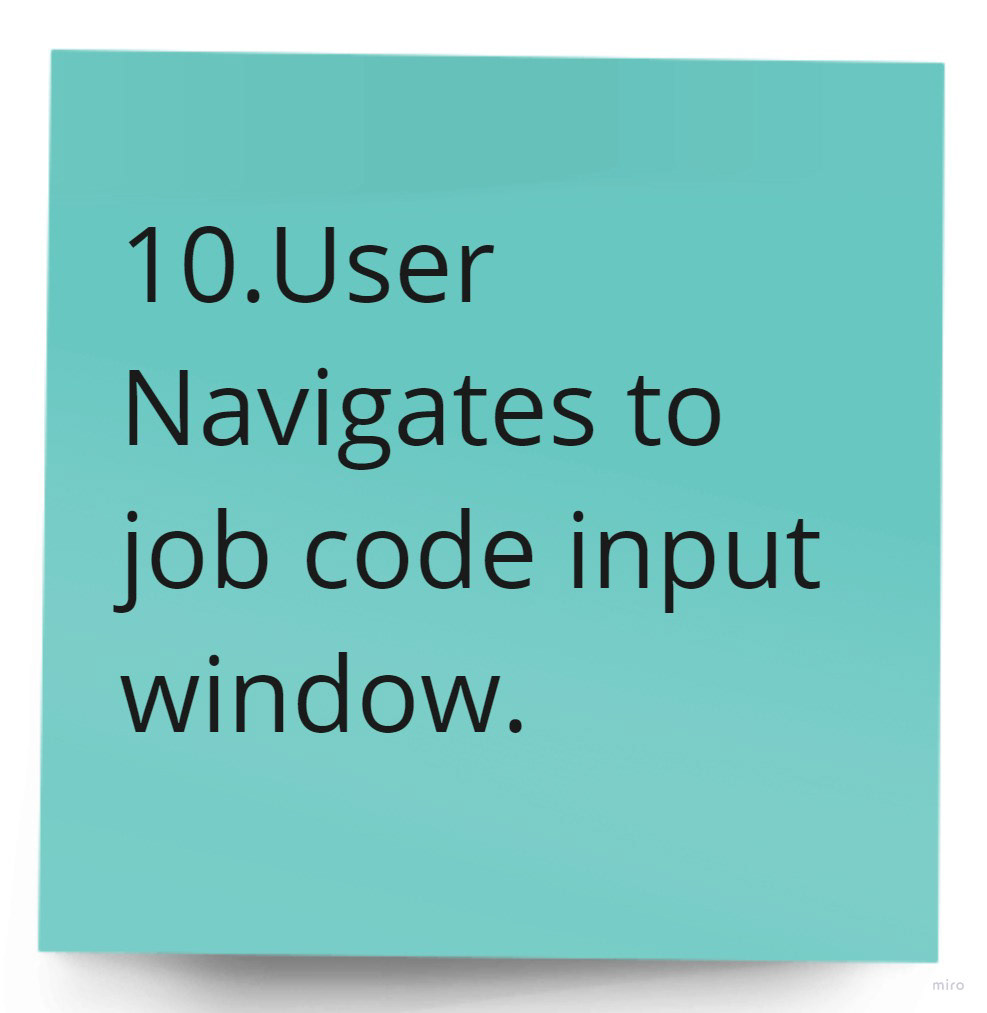
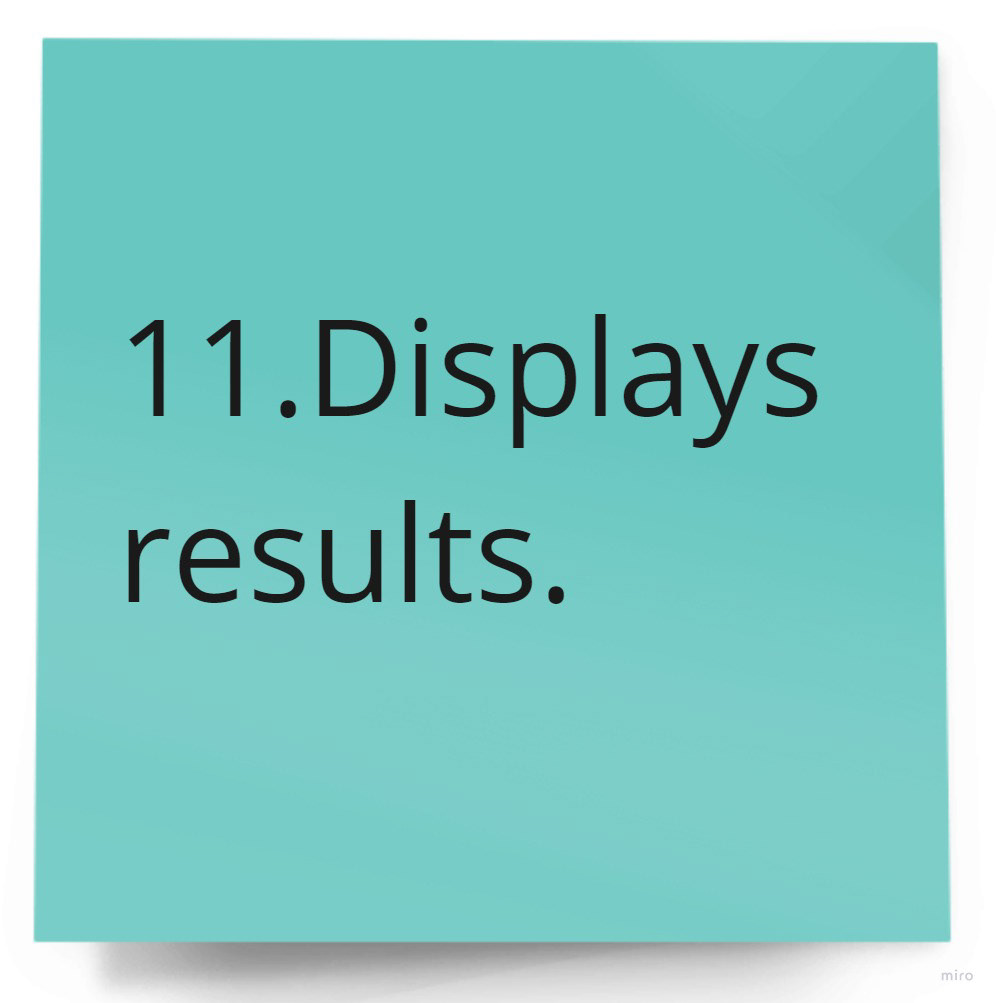
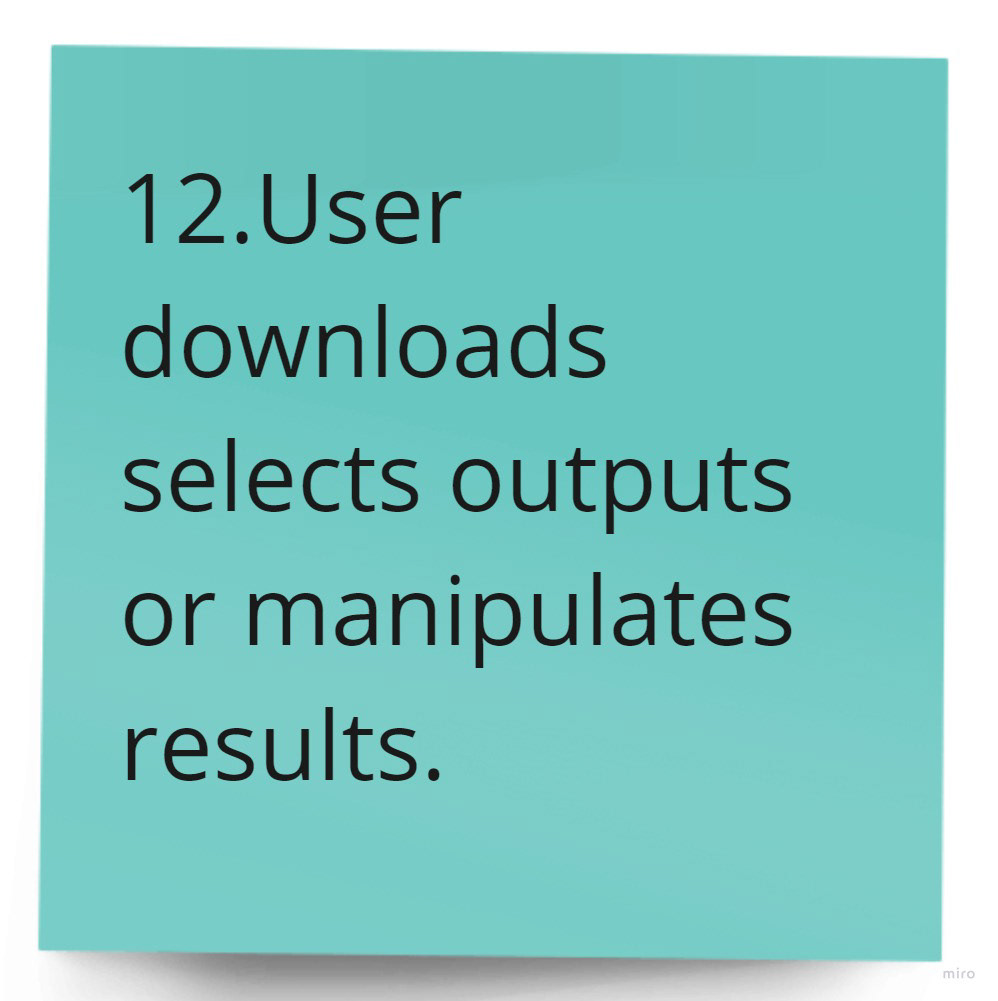
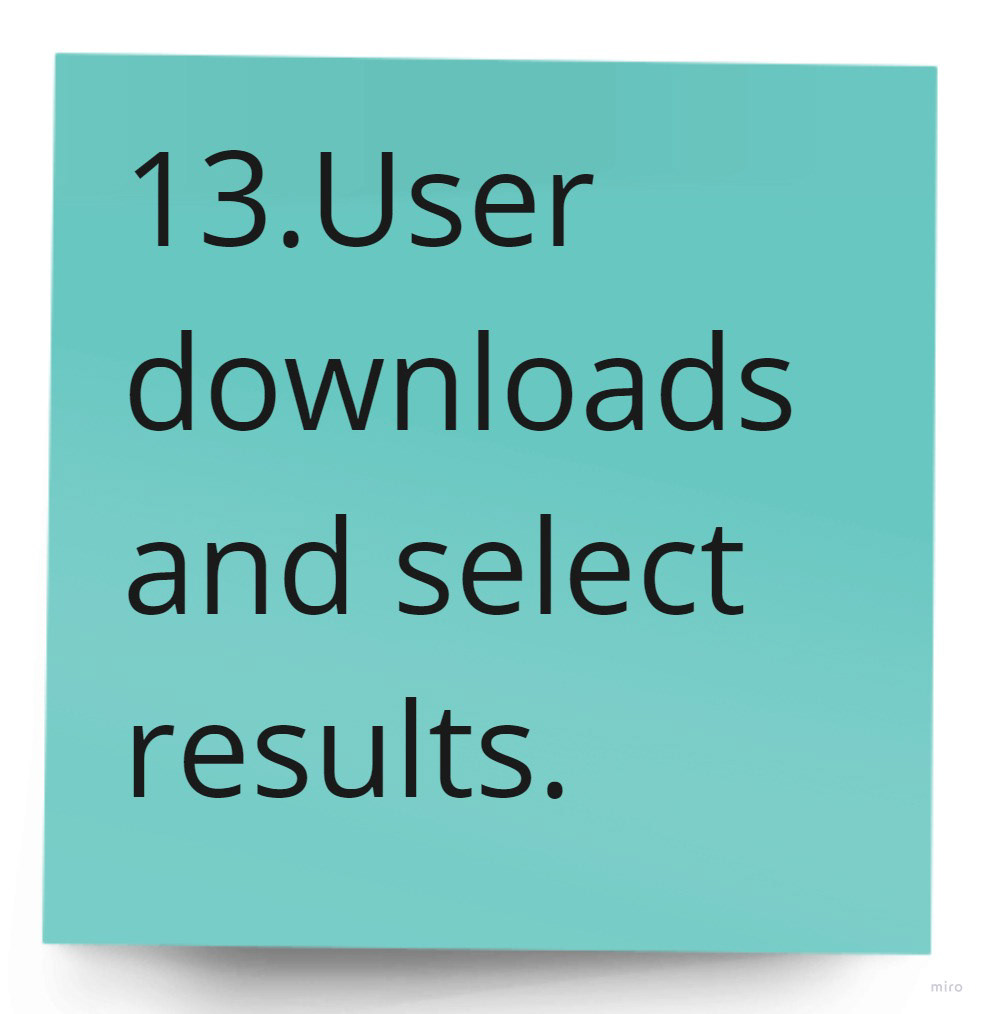
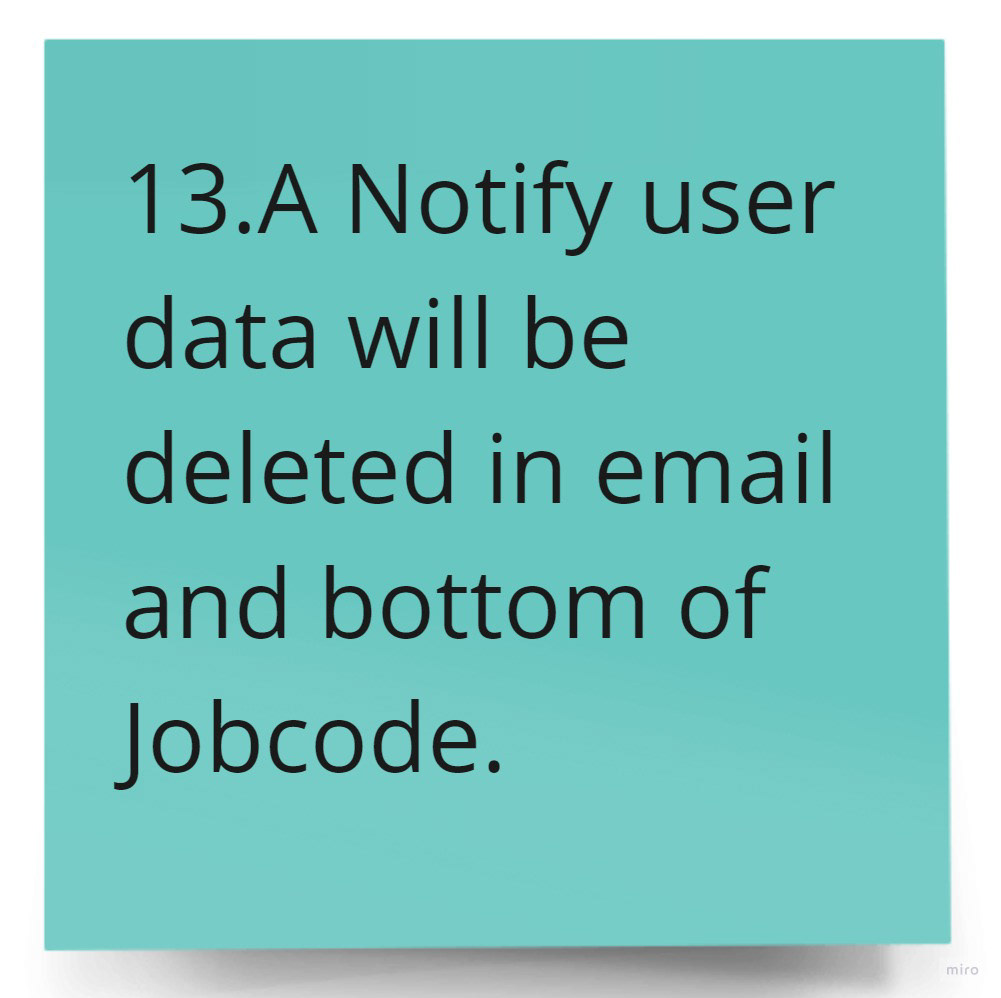
The audience who used this tool consisted of biologists, doctors, undergraduate students, and Ph.D. students. The team began to formulate user scenarios involving the uploading of files to compare group A data to group B data. The following visual is the user journey. To view the document, click here.

Constructing the goals
The audience should feel confident and assured they will find the research they need.
Create an intuitive interface delivering a friendly user experience.
Construct informative content adhering to user goals to complete tasks.
Design a modern brand for users to engage in using the product.
Create an intuitive interface delivering a friendly user experience.
Construct informative content adhering to user goals to complete tasks.
Design a modern brand for users to engage in using the product.
Simplifying user experience
Information Architecture
Planning the structure of the webtool, the analysis of the user scenario dictated that there needed to be five task pages after users uploaded their files to the home page. A simple design to give each task its own page better supported a linear flow and did not overwhelm the user, allowing them to focus on the task at hand.
Carrying it through
Wireframes
The team collaborated through Adobe XD and co-created how to develop an easy and clean transition throughout the pages. We thoughtfully considered the eye-tracking of users to design an effortless flow through the content layouts by aligning major items starting from top to bottom. We repeated styles by placing the continue button in the same location on all pages. Prioritizing the structure created a reliable tool making users feel comfortable. To view wireframes created in Adobe XD, click here.
LANDING PAGE
VALIDATION PAGE
CHOOSE TASK PAGE
GROUPING PAGE
GTEX POP UP
BATCH CORRECTION PAGE
ALGORITHM AND TUNING PAGE
RESULT PAGE
CONTRIBUTORS PAGE
Replicating a friendly system
Logo
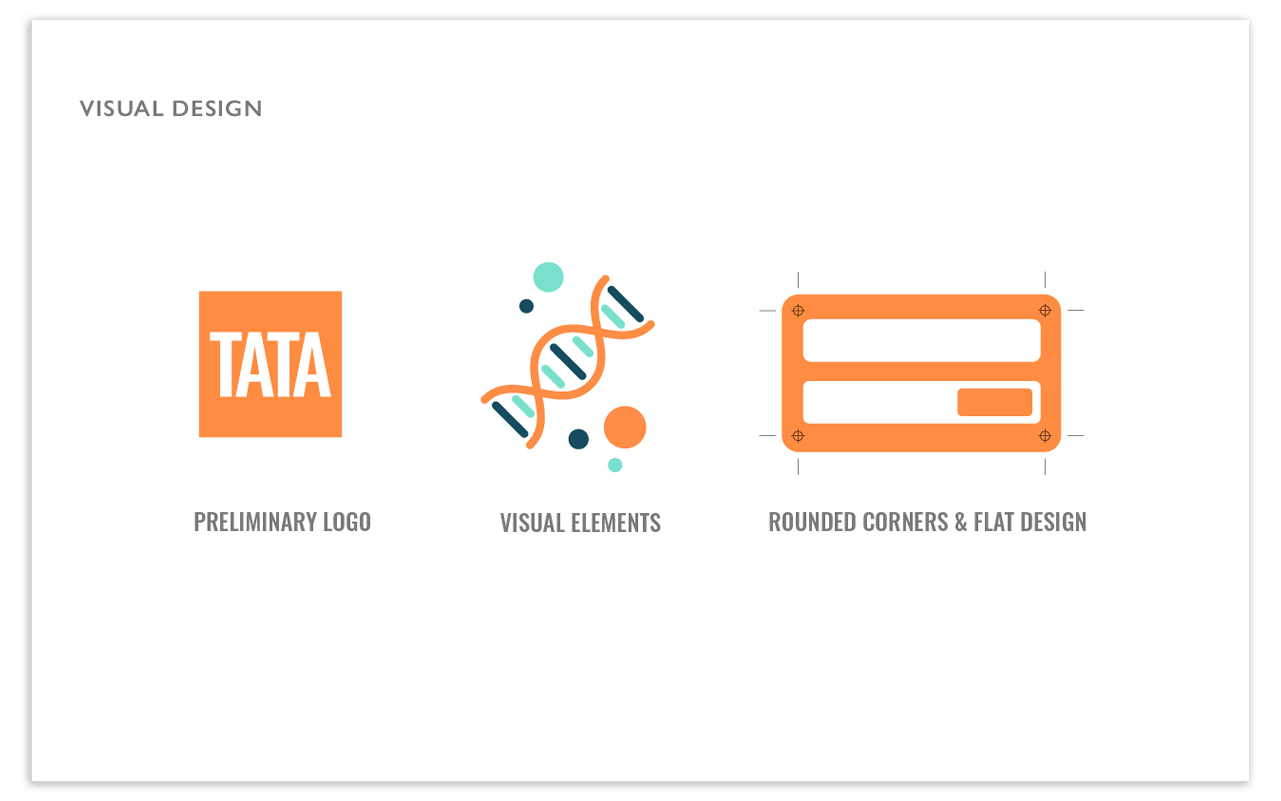
The webtool itself is called TATA and the logo stems from the basic idea of DNA and a TATA Box (TATA is the acronym for Transcription factor Association Tool for Analysis). A TATA Box is a sequence of DNA that serves as the point of initiation for transcription, a function the webtool replicates, and the reason behind the inspiration for the logo.
LOGO
Branding
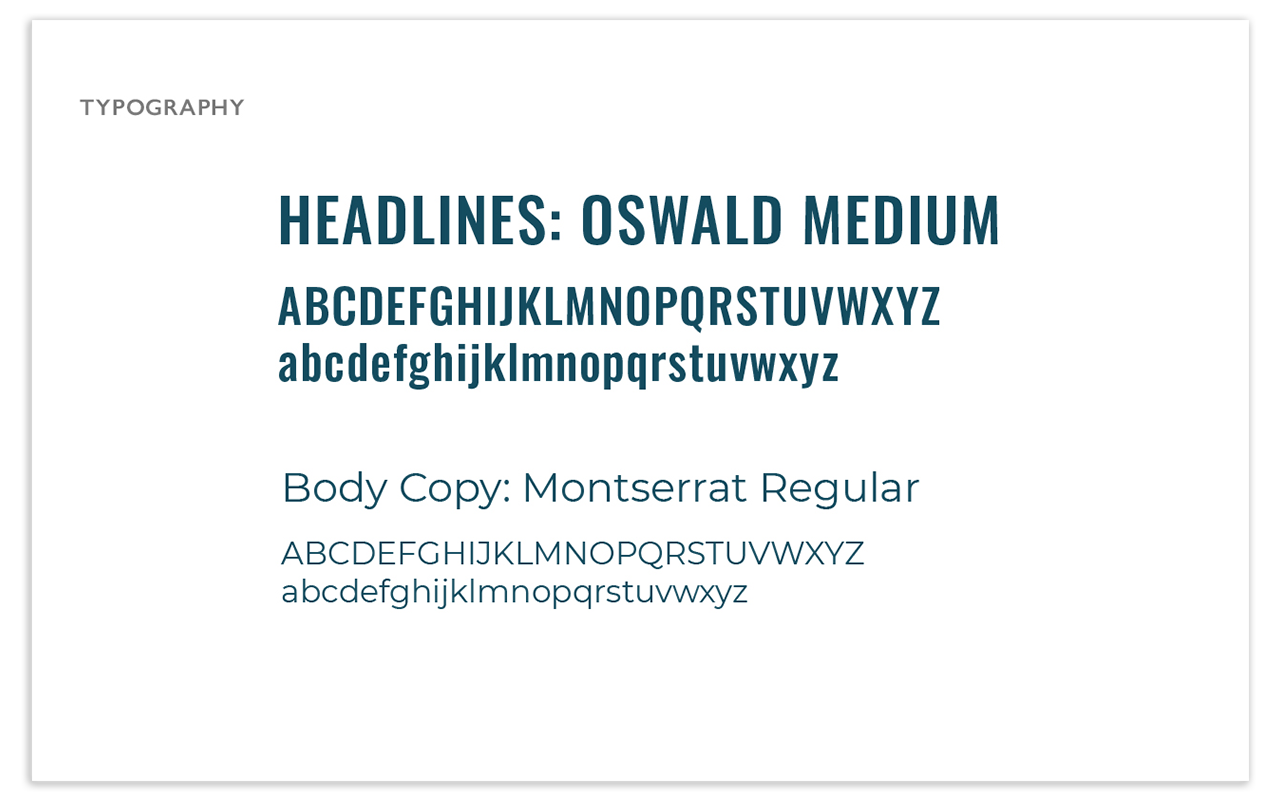
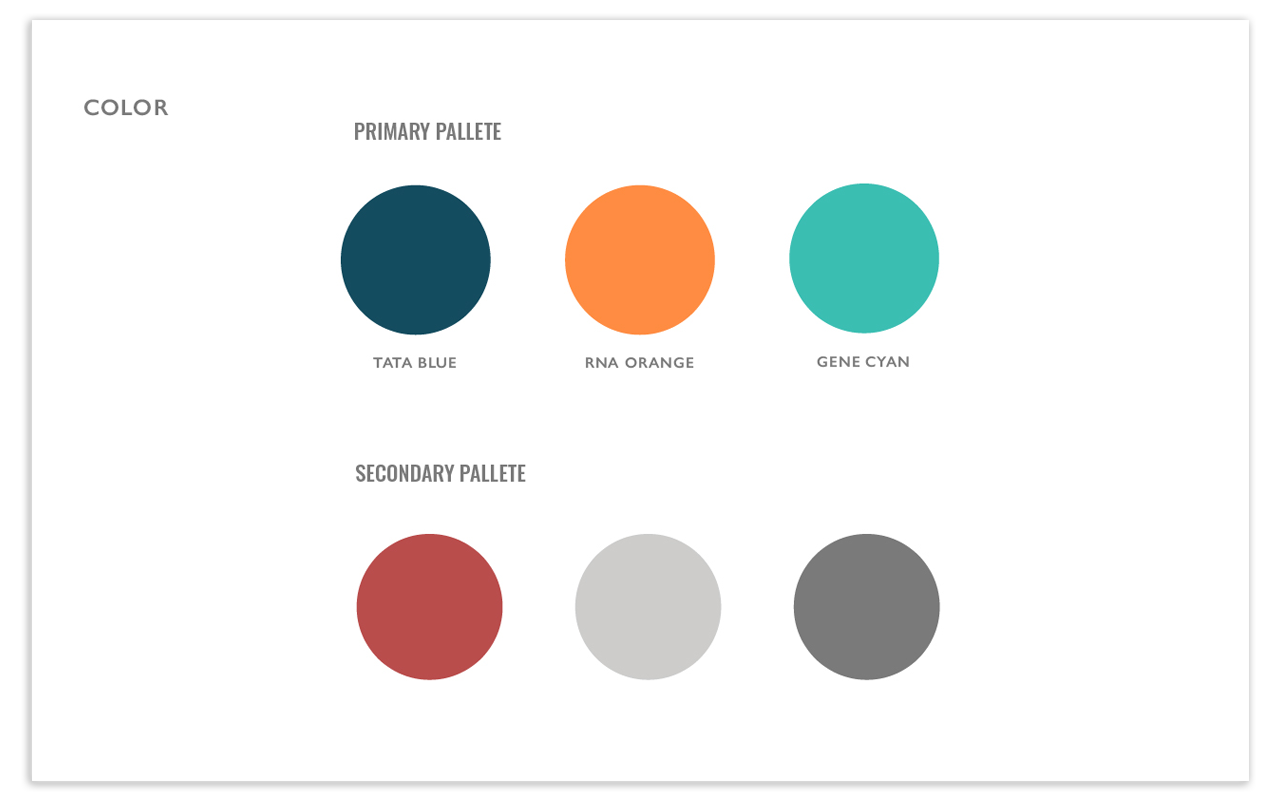
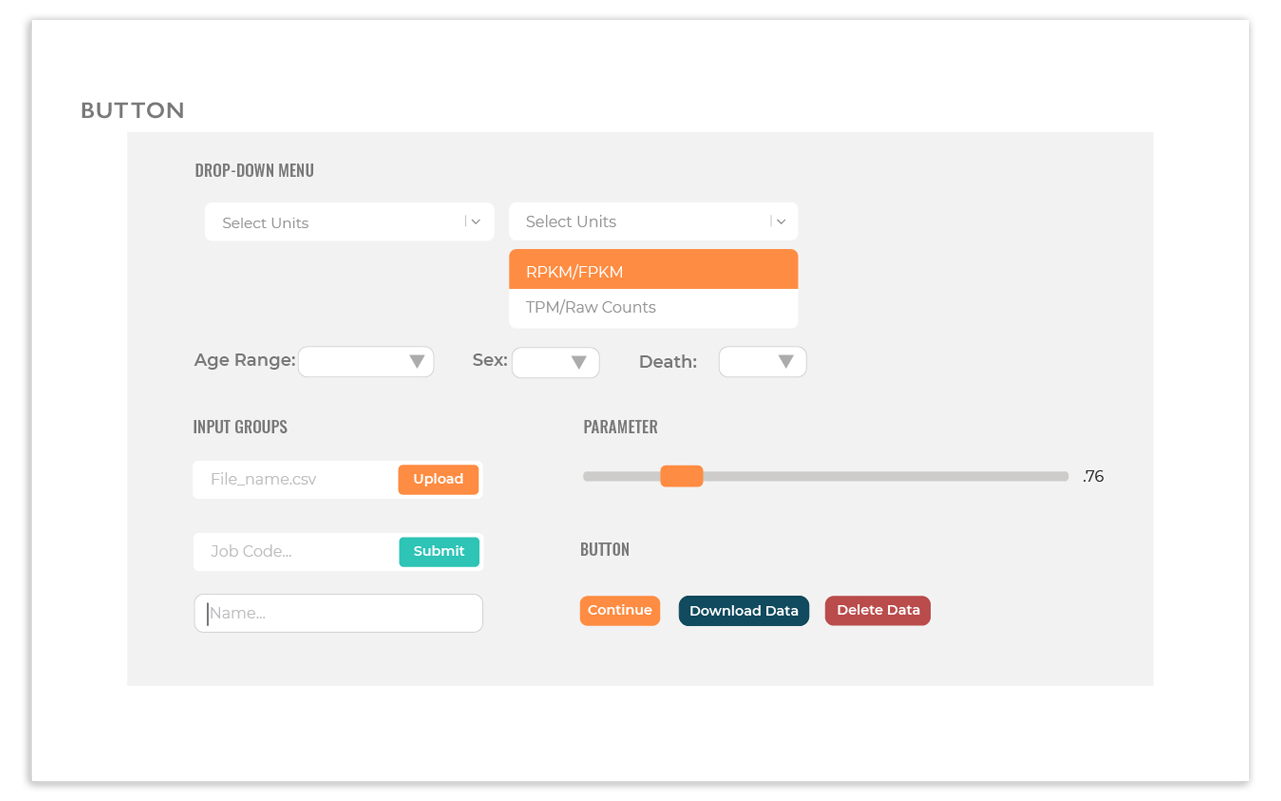
The brand system was designed to feel innovative, intellectual, and friendly. Design is essential in all fields, and the team wanted to increase the attractiveness of the webtool across all audiences. We chose typography and color to guide users to focus on the research they needed. On each page we highlighted user interface elements by adding color to the progress bar, field box, notification, and buttons. A minimal aesthetic helped users navigate the webtool with easy comprehension.
Integrating responsive language
Front-End Development
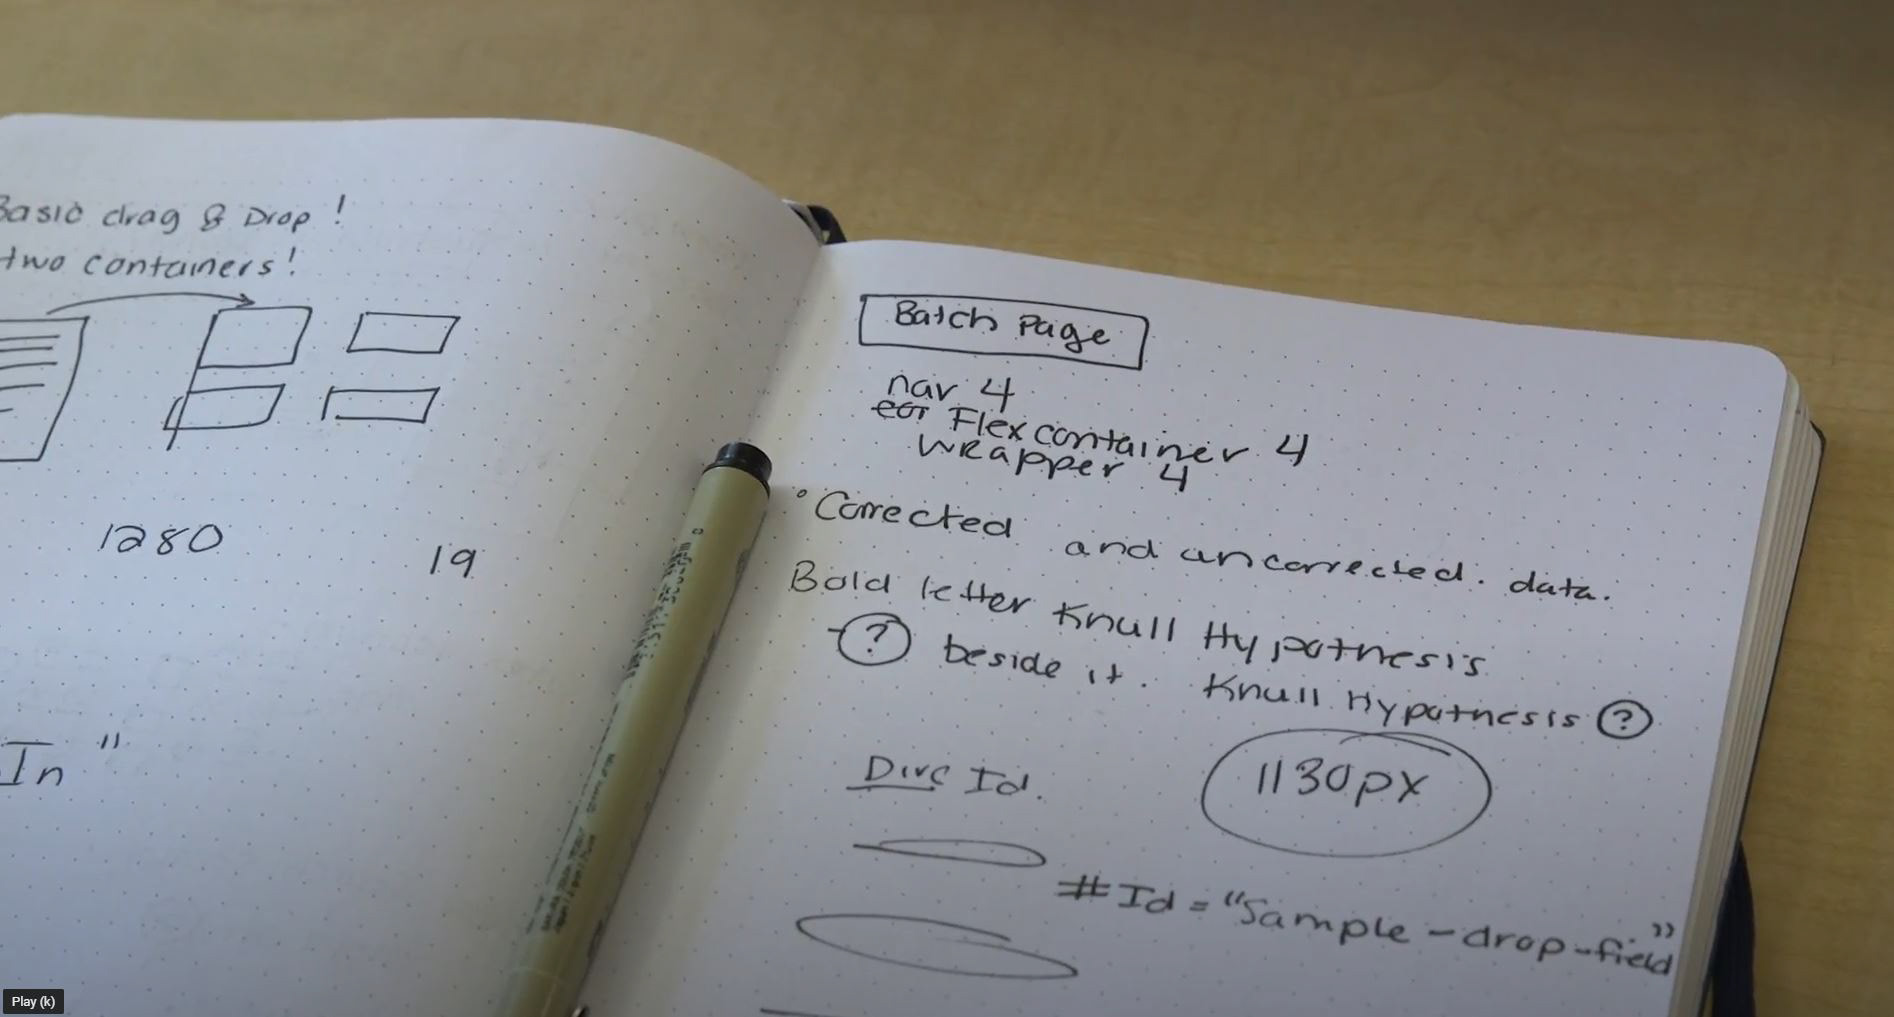
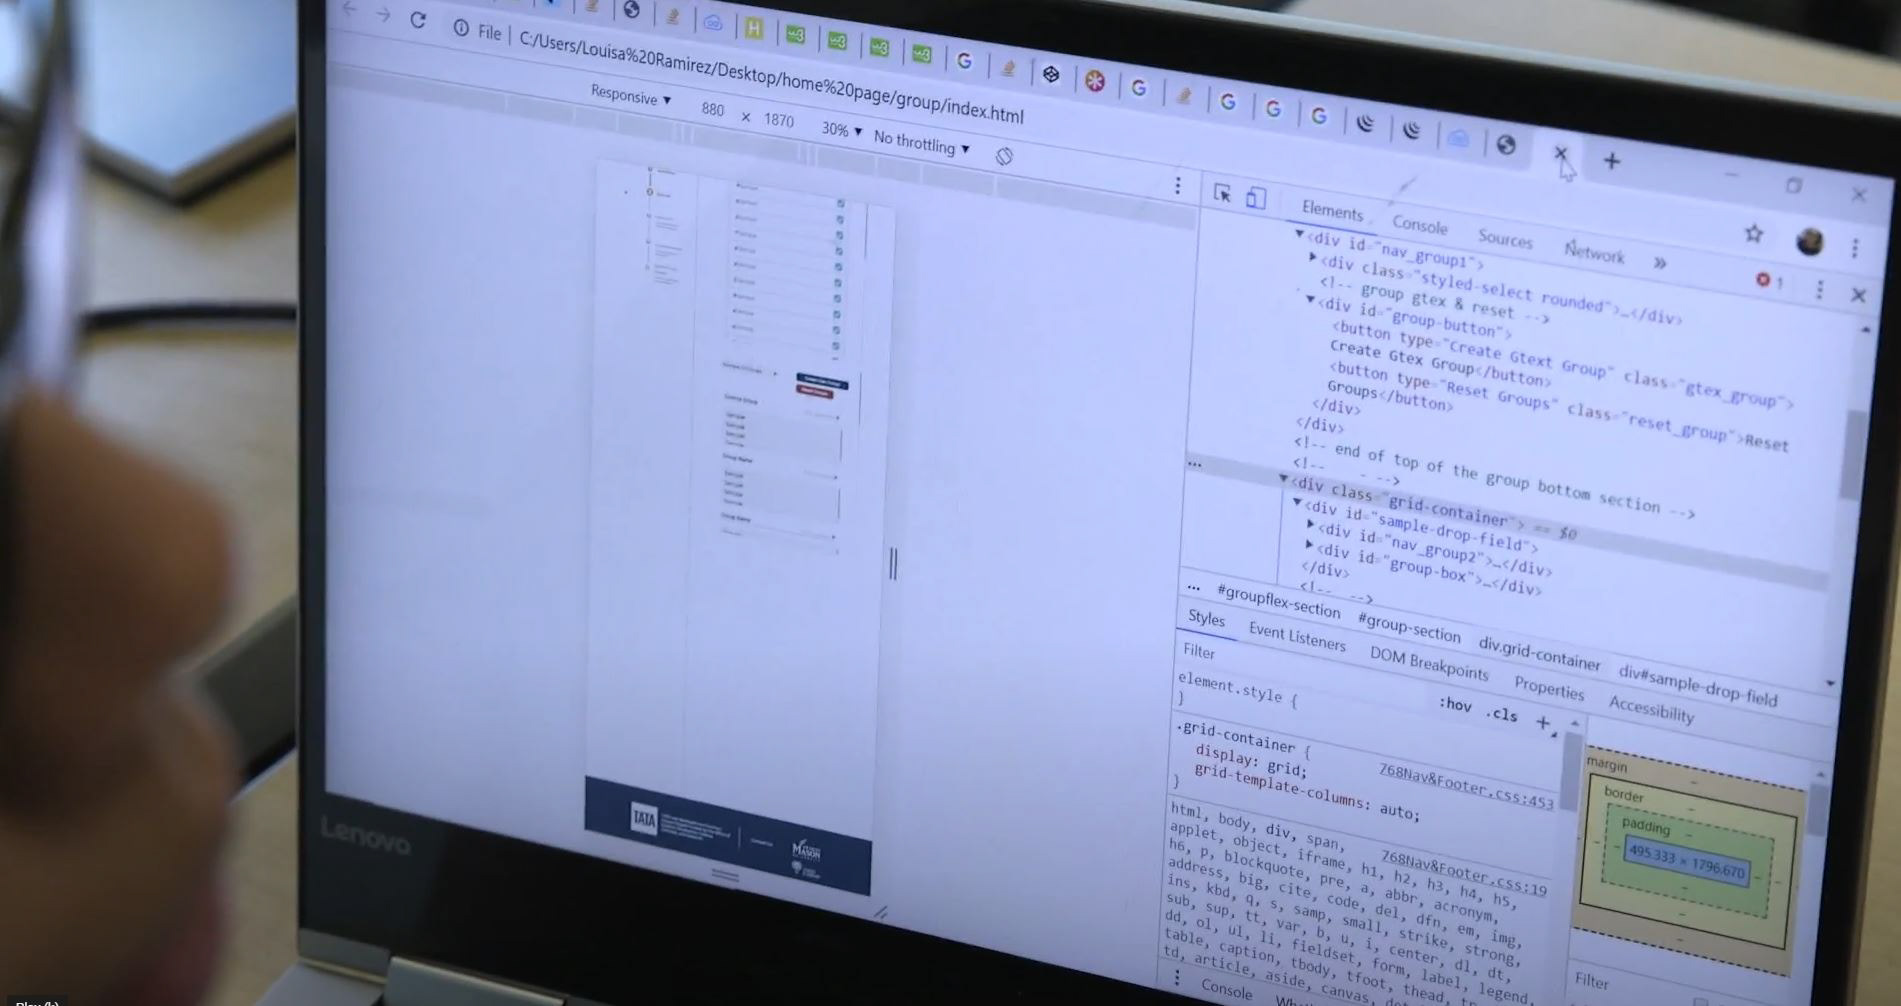
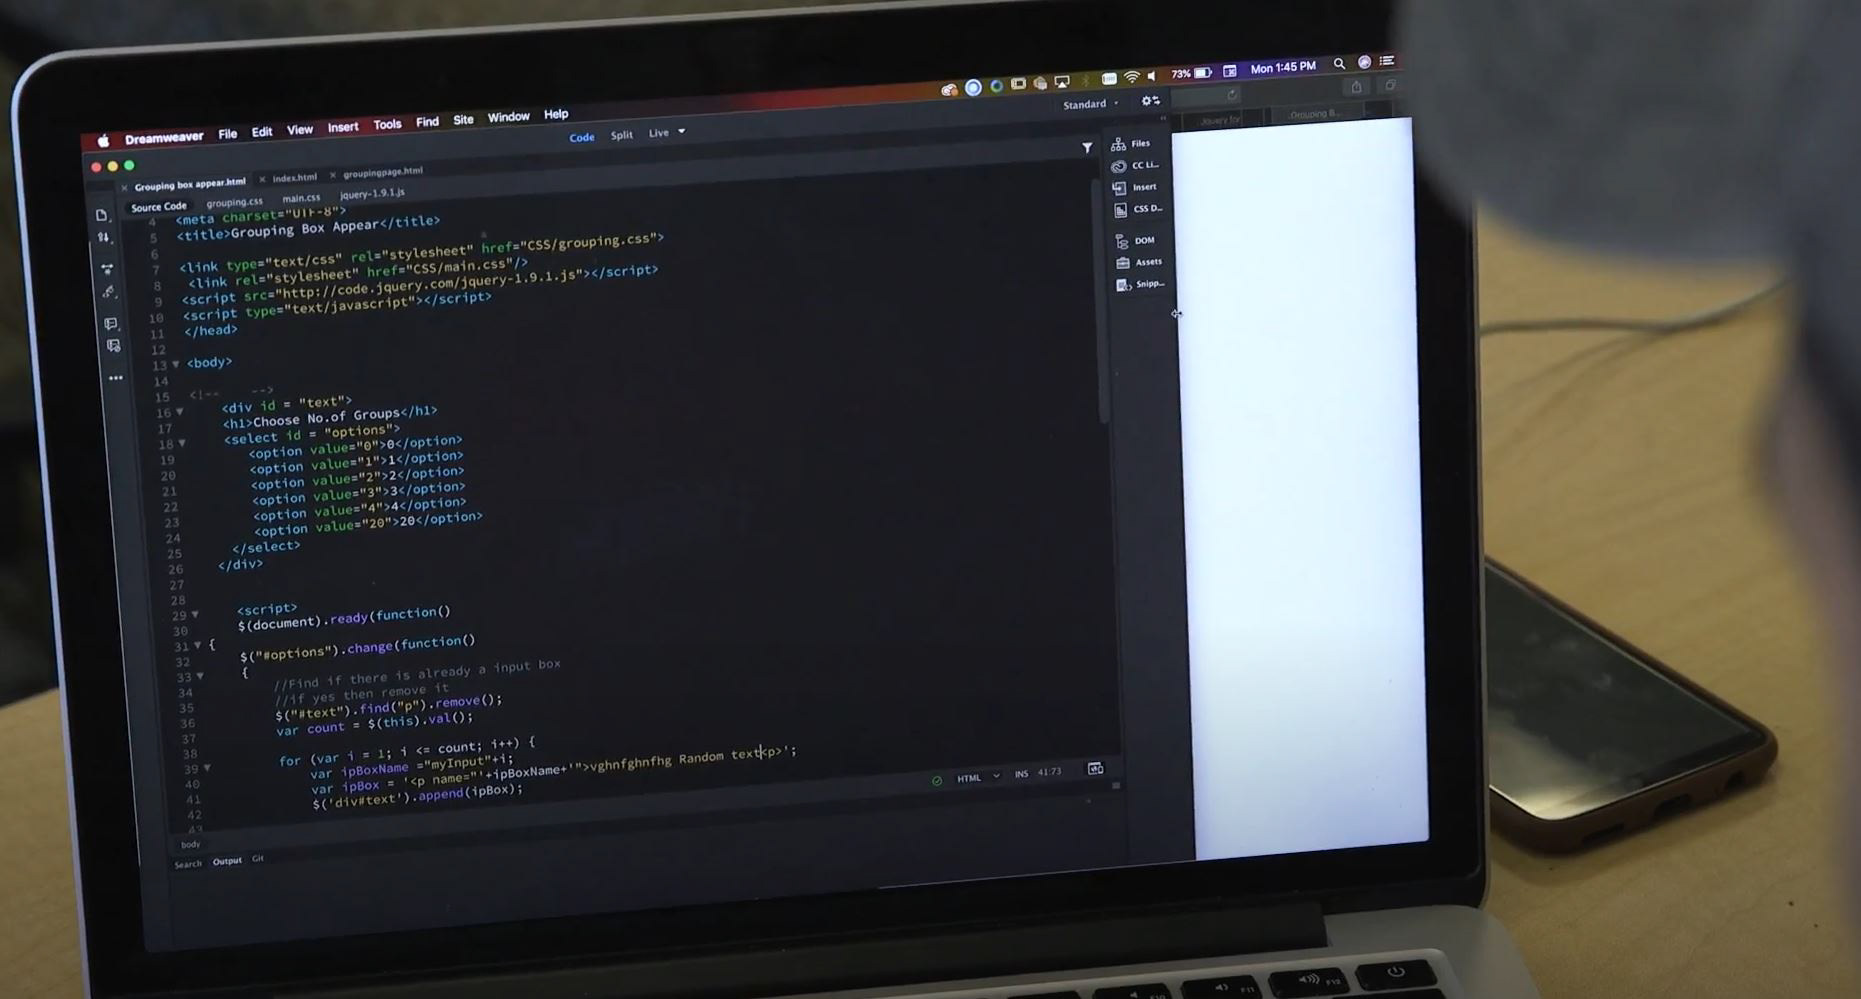
The development process had to adhere to UI/brand guidelines and be responsive for tablet, laptop, and desktop sizes. The starting point was to collaborate with middleware and back-end developers to ensure a functional framework was delivered. The team took the task of assigning pages to each design team member. I worked on the Error Message, Choose Task, Group Samples, and Result pages. We initially used plain JavaScript to carry out functions but discovered it was inoperable when paired with the middleware React application. To mitigate the situation, we sent the React team our code and worked alongside them to integrate it into the React application to deploy functions.
View PDF posters here:
Introducing TATA Webtool
Launch
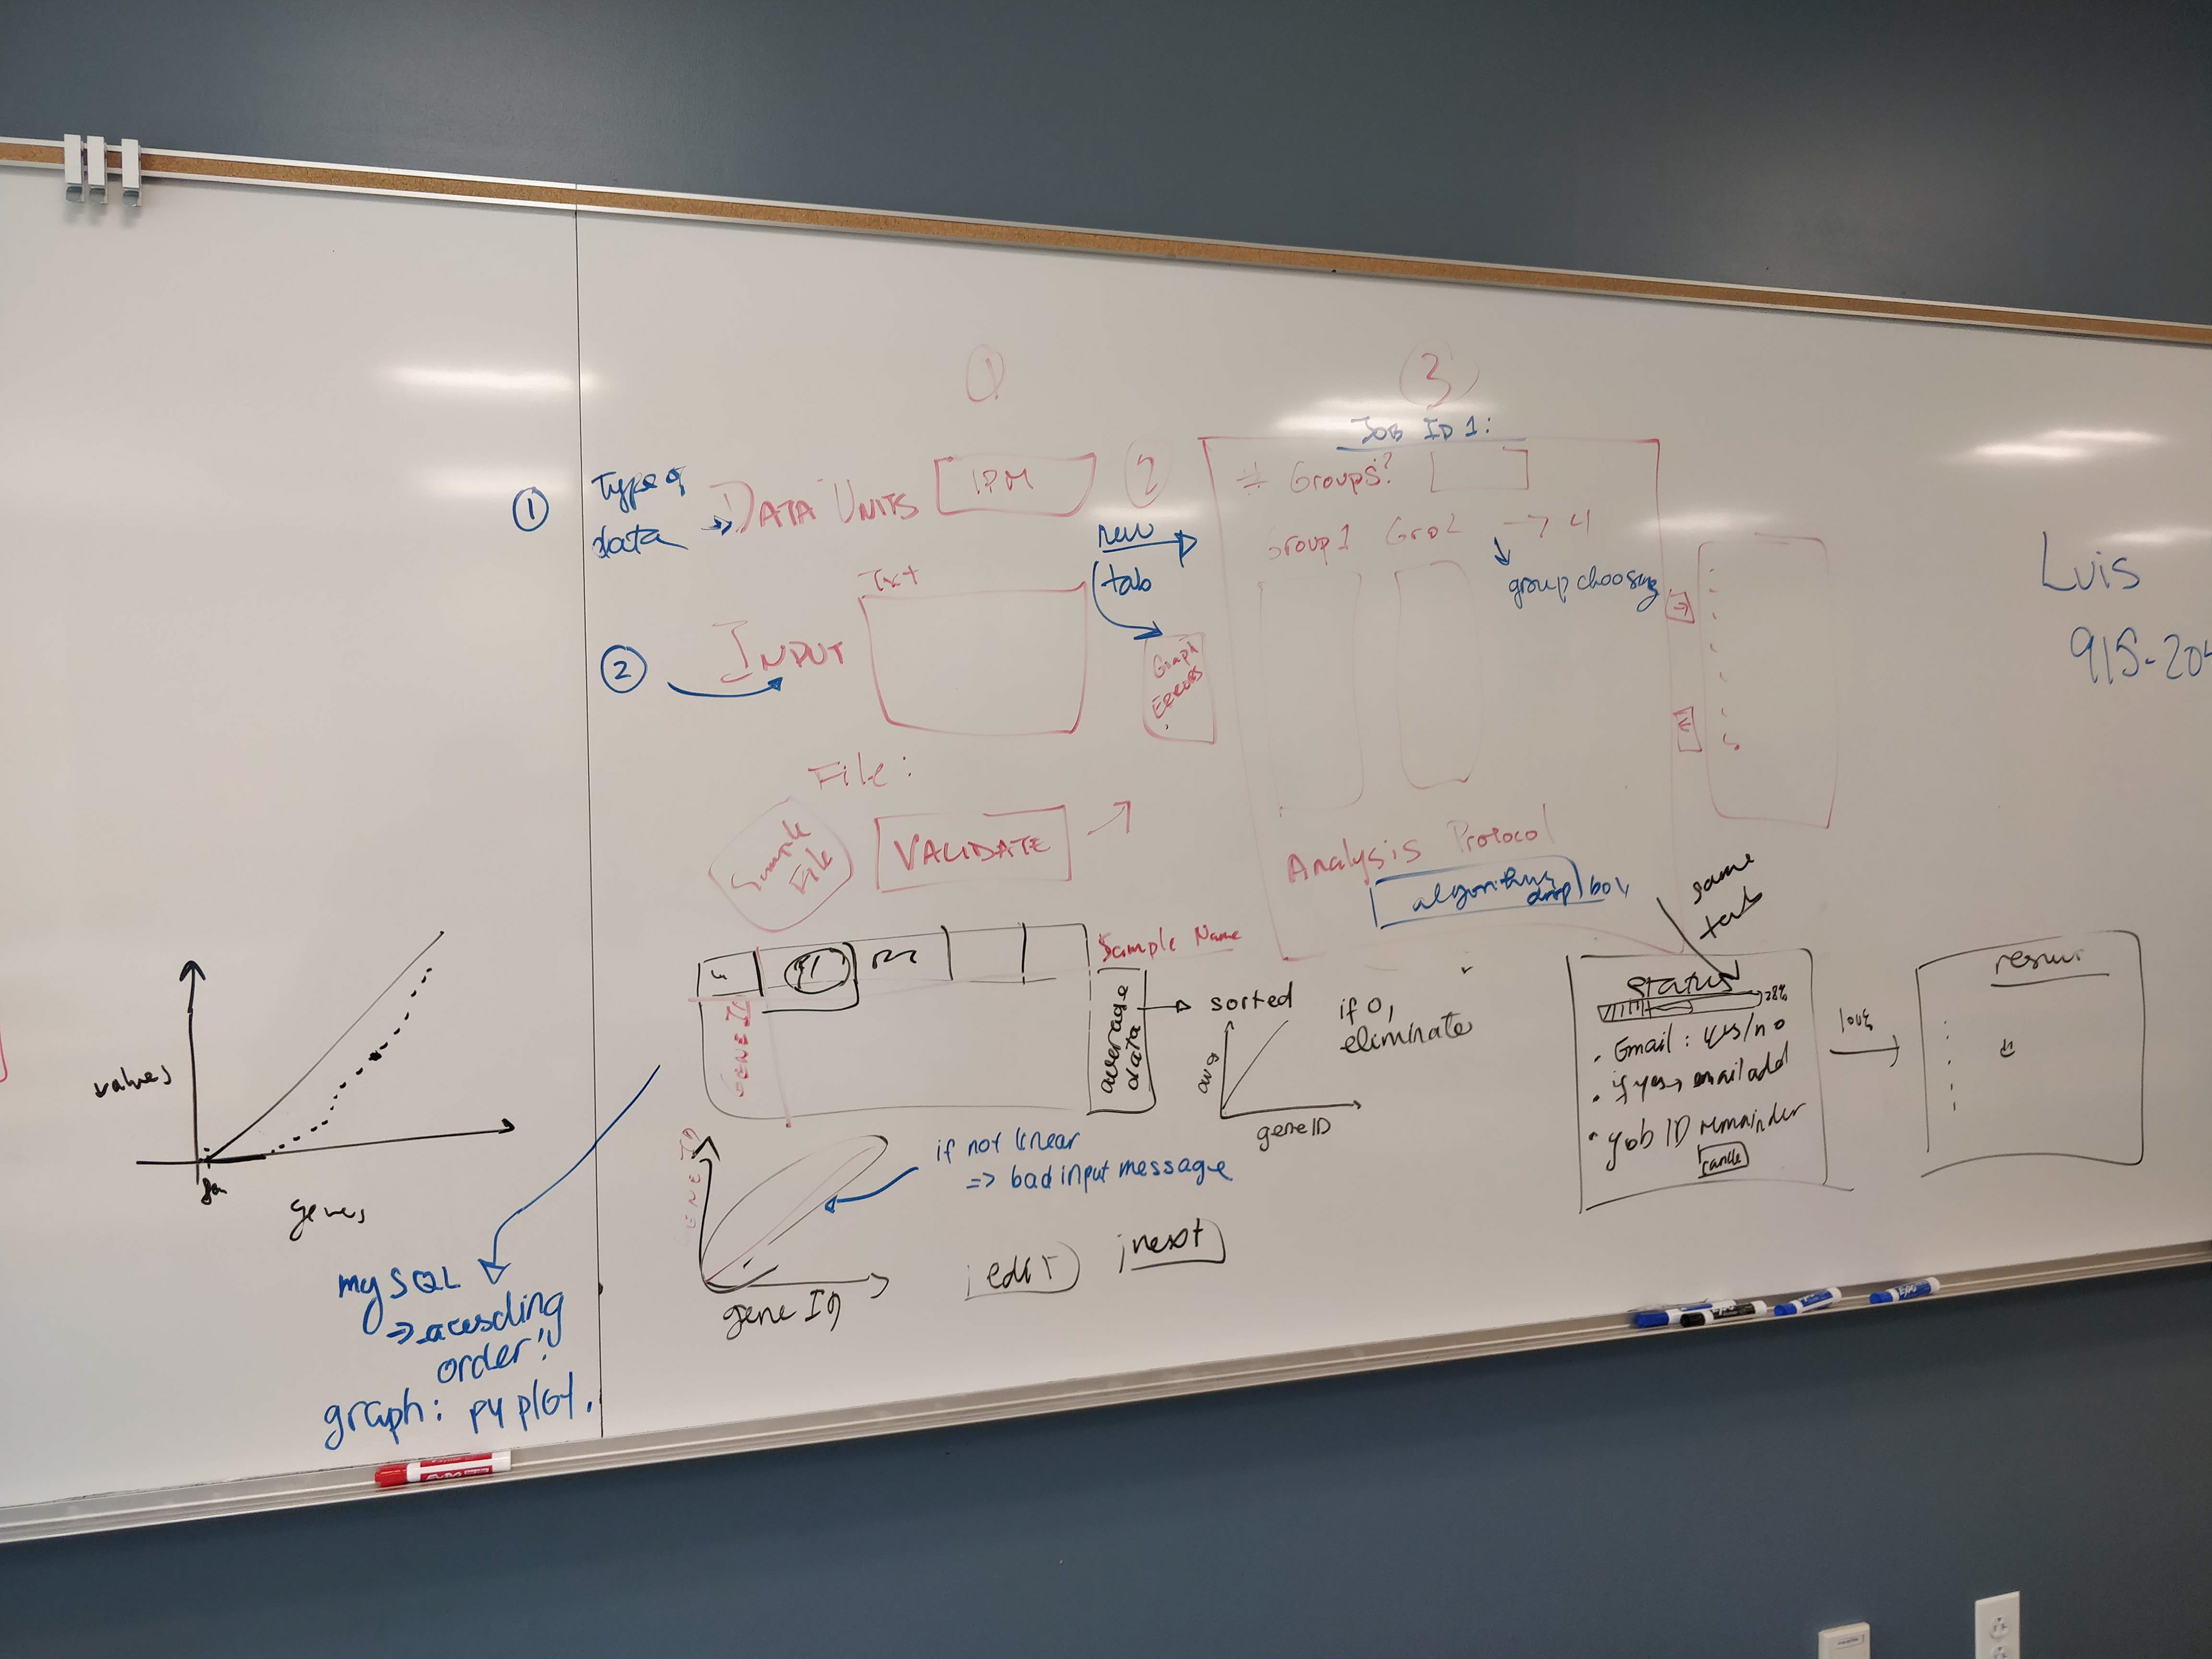
At the end of the ten week development period, we presented the final product at the Summer Celebration of Student Scholarship and Impact at George Mason University. When we created the user-friendly tool, we wanted to empower users to use the web tool to find the research they needed. We provided a demo of the TATA webtool to show how helpful the simple flow aided user interaction.
Takeaways
I joined this journey to collaborate, brainstorm, and ideate with a team. What I learned is the power of visual design can communicate and create an impact on scientific research. The TATA webtool allowed me to collaborate with multidisciplinary team members delivering an intuitive product to fit user needs. Here's a look at our team’s work: view here.
